Grab Deal : Flat 30% off on live classes + 2 free self-paced courses! - SCHEDULE CALL
Grab Deal : Flat 30% off on live classes + 2 free self-paced courses! - SCHEDULE CALL
Multidimensional data refers to datasets that have more than two dimensions or variables. These datasets can be challenging to analyze using traditional statistical methods because they require a different approach. Let's dive more into multidimensionality and learn more about its importance in data science or mining and key takeaways. You should check out the data science training to clarify your basic concepts. This blog post will explore multidimensional data, why it matters, and how you can effectively analyze it.
Multidimensional data refers to any dataset with three or more variables or dimensions. For example, a dataset containing information about customers may include variables such as age, gender, income level, location, purchase history, and so on. Each variable represents a dimension in the dataset.The number of possible combinations between these variables increases exponentially as the number of dimensions grows. As a result, analyzing multidimensional data requires specialized tools and techniques beyond simple charts and graphs.
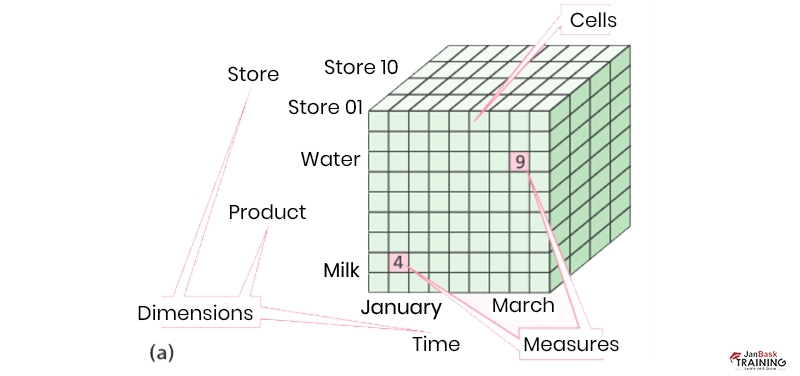
Multidimensional analysis refers to the process of analyzing complex datasets with multiple dimensions or variables simultaneously. It involves examining large volumes of structured and unstructured data to identify patterns or trends across different dimensions.For example, you want to analyze the sales performance of a particular product line over time. In that case, you would need to consider several factors such as geography (region), time (month/quarter/year), product category (electronics/clothing/home appliances), etc., which are all different dimensions.By analyzing these multiple dimensions together through multidimensional analysis techniques like OLAP (online analytical processing) cubes or pivot tables in Excel spreadsheets, analysts can gain deeper insights into their business operations than they could by looking at each dimension individually.
Cube space is an environment where multidimensional models are created using OLAP cubes or similar technologies. These multidimensional database cube models allow users to view their data from multiple perspectives simultaneously by creating virtual "cubes" that represent different combinations of dimensions.
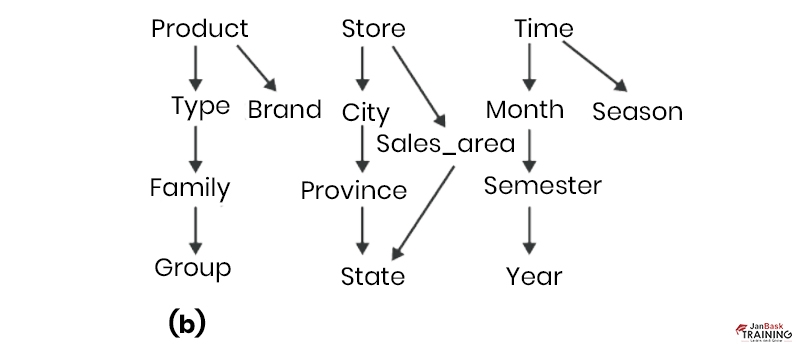
OLAP cubes work by aggregating large volumes of transactional-level detail into summary levels based on user-defined hierarchies across various dimensions like periods, products sold, geographic regions served, etc. The resulting multi-dimensional dataset allows users to drill down into specific areas for further analysis while still maintaining context around related metrics elsewhere within the same cube structure - making it easier than ever before for analysts who may not have technical expertise but still require access to powerful analytics capabilities without requiring extensive training beforehand!
There are several techniques available for analyzing multidimensional data sets:
A multidimensional data model is a database design representing information as facts (measures) organized by dimensions (attributes). In other words, it contains information based on several categories or measurements, such as time, geography, product lines, customer segments, etc., which are used to measure performance metrics like sales revenue or profit margins.
For example, let's say you want to analyze your company's sales performance over time. With a traditional flat database structure, you would have one table with columns for date/time stamps and sales figures. But with a multidimensional approach, you could create separate tables for each dimension—one for dates and times, another for products sold, yet another for geographic regions—all linked together through standard keys so they can be analyzed in any combination desired.
A multidimensional data model is a database design that organizes information into multiple dimensions or categories. It allows users to analyze large amounts of complex data from different perspectives and gain valuable insights that can help improve business operations and decision-making processes.Multidimensionality matters because it allows us to capture more complex relationships between variables than possible with just one or two-dimensional datasets. By including additional dimensions in our analysis, we can identify patterns that might otherwise remain hidden.
For example, consider an e-commerce website trying to optimize its product recommendations for individual users based on their browsing history and purchase behavior. By analyzing multidimensional customer profiles (e.g., demographics, past purchases, and search queries), the site could generate personalized recommendations tailored specifically to each user's unique preferences.
Multidimensional databases offer several advantages over traditional flat databases when it comes to analyzing large volumes of complex business-related information:
“Prediction Mining in Cube Space" discusses using prediction cubes in data mining. It explains that a prediction cube is a multi-dimensional array of cells, where each cell contains a predicted outcome for a specific combination of input variables. This method allows for analyzing and visualizing complex data sets with multiple variables, making it easier to identify patterns and make predictions.Research has shown that using prediction cubes can significantly improve the accuracy of predictive models. In one study conducted by researchers at Carnegie Mellon University, they used prediction cubes to analyze medical data and predict patient outcomes. They found that their model was 20% more accurate when using this method than traditional methods.
Additionally, companies such as IBM have implemented this technique in their business intelligence software, allowing users to visualize and analyze large amounts of data quickly and easily.Overall, using prediction cubes in data mining efficiently analyzes complex datasets with multiple variables while improving predictive accuracy. This technique will continue to be an important tool for businesses seeking insights from big data analytics.
Here are some examples of where companies have used multi-dimensional modeling effectively:
In today's data-driven world, businesses generate vast amounts of data daily. This data is collected from various sources, such as social media, customer interactions, sales transactions, etc. To make sense of this massive amount of information, businesses need to use advanced analytical tools that can help them uncover valuable insights hidden within the data.

Data Science Training
Multidimensionality provides an excellent opportunity for organizations seeking deep insights into their business operations by seamlessly combining disparate sets of structured/unstructured big data under one roof via sophisticated reporting/analytics tools available today in marketplaces everywhere! Whether the retail industry is trying to optimize supply chain efficiency, healthcare providers aiming to deliver high-quality, affordable care to patients benefit greatly by adopting new approaches towards managing complexity inherent in modern-day enterprises. Understanding multidimensionality in data mining begins with understanding data science; you can get an insight into the same through our training and certification courses.

Basic Statistical Descriptions of Data in Data Mining
 May 11, 2023
  8.1k
8.1k Mar 03, 2023 8.1k
Rule-Based Classification in Data Mining
Mar 27, 2023 7.6k
Introduction to Data Objects in Data Mining
Mar 06, 2023 7.5k
Cyber Security

QA

Salesforce

Business Analyst

MS SQL Server

Data Science

DevOps

Hadoop

Python

Artificial Intelligence

Machine Learning

Tableau
Download Syllabus
Get Complete Course Syllabus
Enroll For Demo Class
It will take less than a minute
Tutorials
Interviews
You must be logged in to post a comment