WO2002005066A2 - Method and system for multi-period performance attribution - Google Patents
Method and system for multi-period performance attribution Download PDFInfo
- Publication number
- WO2002005066A2 WO2002005066A2 PCT/US2001/041307 US0141307W WO0205066A2 WO 2002005066 A2 WO2002005066 A2 WO 2002005066A2 US 0141307 W US0141307 W US 0141307W WO 0205066 A2 WO0205066 A2 WO 0205066A2
- Authority
- WO
- WIPO (PCT)
- Prior art keywords
- attribution
- period
- performance
- portfolio
- sector
- Prior art date
Links
Classifications
-
- G—PHYSICS
- G06—COMPUTING; CALCULATING OR COUNTING
- G06Q—INFORMATION AND COMMUNICATION TECHNOLOGY [ICT] SPECIALLY ADAPTED FOR ADMINISTRATIVE, COMMERCIAL, FINANCIAL, MANAGERIAL OR SUPERVISORY PURPOSES; SYSTEMS OR METHODS SPECIALLY ADAPTED FOR ADMINISTRATIVE, COMMERCIAL, FINANCIAL, MANAGERIAL OR SUPERVISORY PURPOSES, NOT OTHERWISE PROVIDED FOR
- G06Q40/00—Finance; Insurance; Tax strategies; Processing of corporate or income taxes
- G06Q40/06—Asset management; Financial planning or analysis
-
- G—PHYSICS
- G06—COMPUTING; CALCULATING OR COUNTING
- G06Q—INFORMATION AND COMMUNICATION TECHNOLOGY [ICT] SPECIALLY ADAPTED FOR ADMINISTRATIVE, COMMERCIAL, FINANCIAL, MANAGERIAL OR SUPERVISORY PURPOSES; SYSTEMS OR METHODS SPECIALLY ADAPTED FOR ADMINISTRATIVE, COMMERCIAL, FINANCIAL, MANAGERIAL OR SUPERVISORY PURPOSES, NOT OTHERWISE PROVIDED FOR
- G06Q20/00—Payment architectures, schemes or protocols
- G06Q20/08—Payment architectures
- G06Q20/10—Payment architectures specially adapted for electronic funds transfer [EFT] systems; specially adapted for home banking systems
- G06Q20/102—Bill distribution or payments
-
- G—PHYSICS
- G06—COMPUTING; CALCULATING OR COUNTING
- G06Q—INFORMATION AND COMMUNICATION TECHNOLOGY [ICT] SPECIALLY ADAPTED FOR ADMINISTRATIVE, COMMERCIAL, FINANCIAL, MANAGERIAL OR SUPERVISORY PURPOSES; SYSTEMS OR METHODS SPECIALLY ADAPTED FOR ADMINISTRATIVE, COMMERCIAL, FINANCIAL, MANAGERIAL OR SUPERVISORY PURPOSES, NOT OTHERWISE PROVIDED FOR
- G06Q40/00—Finance; Insurance; Tax strategies; Processing of corporate or income taxes
- G06Q40/03—Credit; Loans; Processing thereof
-
- G—PHYSICS
- G06—COMPUTING; CALCULATING OR COUNTING
- G06Q—INFORMATION AND COMMUNICATION TECHNOLOGY [ICT] SPECIALLY ADAPTED FOR ADMINISTRATIVE, COMMERCIAL, FINANCIAL, MANAGERIAL OR SUPERVISORY PURPOSES; SYSTEMS OR METHODS SPECIALLY ADAPTED FOR ADMINISTRATIVE, COMMERCIAL, FINANCIAL, MANAGERIAL OR SUPERVISORY PURPOSES, NOT OTHERWISE PROVIDED FOR
- G06Q40/00—Finance; Insurance; Tax strategies; Processing of corporate or income taxes
- G06Q40/04—Trading; Exchange, e.g. stocks, commodities, derivatives or currency exchange
Definitions
- the present invention relates to methods for performing performance attribution to compare the returns of a financial portfolio against those of a benchmark, and attribute the relative performance to various effects resulting from active decisions by the portfolio manager. More particularly, the invention is an improved method for linking single-period attribution effects over multiple periods, using either an arithmetic or a geometric methodology.
- Performance attribution In performing performance attribution, the returns of a portfolio are compared against those of a benchmark, and the excess return (i.e., relative performance) is attributed to various effects resulting from active decisions by the portfolio managers. Performance attribution is a rich and complex topic, which can be viewed from many angles. There are a variety of conventional methods for performing attribution based on a single-period analysis. However, if performance is measured over an extended length of time, a single-period buy-and-hold analysis may lead to significant errors, especially for highly active portfolios. Therefore, it is imperative to link the single-period attribution effects over multiple periods in an accurate and meaningful way. The two basic approaches that have arisen for such linking are the arithmetic and geometric methodologies.
- An advantage of the arithmetic approach is that it is more intuitive. For instance, if the portfolio return is 21% and the benchmark return is 10%, most people regard the relative performance to be 11%, as opposed to 10%.
- An advantage of geometric attribution is the ease with which attribution effects can be linked over time.
- Carino describes one possible algorithm for linking attribution effects over time that results in a multi-period arithmetic performance attribution system. Furthermore, the result is residual free in that the sum of the linked attribution effects is exactly equal to the difference in linked returns.
- Carino discloses an arithmetic performance attribution method which determines portfolio relative performance over multiple time periods as a sum of terms of form (R, - R t ) ⁇ t , where the index " t " indicates one time period, and where Carino's coefficients ⁇ t are
- new coefficients (A + a t ) to be defined below replace Carino's coefficients ⁇ t (sometimes referred to herein as conventional
- logarithmic coefficients have a much smaller standard deviation than the conventional logarithmic coefficients. Reducing the standard deviation of the coefficients is important in order to minimize the distortion that arises from overweighting certain periods relative to others.
- the value of A is preferably
- the inventive coefficients (A + a t ) have smaller (and typically much smaller) standard deviation than the conventional logarithmic coefficients (in cases in which A has the preferred value), which reduces variation in the weights assigned to each time period relative to the other time periods in the attribution calculation.
- Vs y is an attribution effect (issue selection)
- the values of Tt z are T and the
- T t In other embodiments,
- the attribution effects employed in preferred embodiments of the inventive geometric attribution method have more natural form than those employed in conventional geometric attribution methods (such as the geometric attribution method of the above- cited Carino paper), since the inventive attribution effects are defined as ratios rather than exponentials. Further, the inventive definitions allow the geometric attribution method to be performed more accurately than the geometric attribution performed using the attribution effects as defined by Carino.
- aspects of the invention are a computer system programmed to perform any embodiment of the inventive method, and a computer readable medium which stores code for implementing any embodiment of the inventive method.
- Figure la is a contour plot of the average logarithmic coefficients, determined in accordance with the prior art, resulting from a set of simulations.
- Figure lb is a contour plot of the average inventive coefficients resulting from the same simulations which determined Fig. la.
- Figure 2a is plot of normalized standard deviation for the conventional logarithmic coefficients, assuming the same set of distributions that were assumed to generate Figures la and lb.
- Figure 2b is plot of normalized standard deviation for the inventive coefficients, assuming the same set of distributions that were assumed to generate Figs, la and lb.
- Figure 3 is a block diagram of a computer system for implementing any embodiment of the inventive method.
- Figure 4 is an elevational view of a computer readable optical disk on which is stored computer code for implementing any embodiment of the inventive method.
- the arithmetic performance attribution method of the present invention is an improved approach to arithmetic linking over multiple periods.
- the methodology described herein is based on an optimal distribution of the residual among the different time periods. Such an approach minimizes the distortion that arises from overweighting certain time periods relative to others.
- the resulting attribution system is also residual free, robust, and completely general, so that performance can be linked without complication for any set of sector weights and returns.
- the geometric performance attribution method of the present invention represents a fundamentally different definition for the geometric attribution effects, since the attribution effects are defined in terms of ratios rather than exponentials. This form, which is more natural, also results in an improved approximation over previous methods.
- the portfolio return R, for a single period t can be written as the weighted average return over N sectors
- v and ru are the portfolio weights and returns for sector i and period t, respectively.
- v and ru are the portfolio weights and returns for sector i and period t, respectively.
- the issue selection l t measures how well the portfolio manager picked overperforming securities in sector i during period t.
- A is taken to have some other value.
- this choice for the value of A guarantees smaller standard deviation among the coefficients ⁇ estek than among the logarithmic coefficients taught by Carino.
- the logarithmic coefficients (21) are similar to their optimized counterparts (19) in that both lead to residual-free linking. However, the logarithmic coefficients tend to overweight periods with lower-than-average returns, and to underweight those with higher-than-average returns. This appears to be an artifact of the linking algorithm, and not to be grounded in any economic principle.
- the optimized coefficients tend to weight each period as evenly as possible.
- Carino defines the geometric attribution effects in terms of an exponential function of the corresponding arithmetic attribution effect multiplied by a corrective factor k t .
- T t which plays a role equivalent to Carino's k t , is given by
- the total geometric issue selection lf' Vestek for period t is defined in terms of the product of the contributions over all sectors
- Equation (33) is the fully geometric analog of equation (9).
- Equation (35) is the fully geometric analog of equation (20). In the Carino approach, the corresponding result is given by
- attribution effects defined in preferred embodiments of the inventive geometric attribution method have more natural form than the conventional attribution effects (such as those employed in the geometric attribution method of the above-cited Carino paper), since the inventive attribution effects are defined as ratios rather than exponentials.
- the mventive attribution effects allow the inventive geometric attribution method to be performed more accurately than geometric attribution performed using the Carino approach. This can be established quantitatively by recognizing that the basic approximation involved is found by setting the corrective factors k t and F t equal to unity. In other words, the approximation involved in the Carino method is
- R t is the semi-notional return defined by
- the attribution effect can be written as a sum of differences
- the computer system of Figure 3 includes processor 1, input device 3 coupled to processor 1, and display device 5 coupled to processor 1.
- Processor 1 is programmed to implement the inventive method in response to instructions and data entered by user manipulation of input device 3.
- Computer readable optical disk 7 of Fig. 4 has computer code stored thereon. This code is suitable for programming processor 1 to implement an embodiment of the inventive method.
Abstract
A method for arithmetic and geometric performance attribution which accurately links single-periods attribution effects over multiple periods. The arithmetic attribution method optimally distributes the residual to yield a minimum-distortion residual-free arithmetic attribution system. The geometric attribution method defines the attribution effects in terms of ratios. The arithmetic method determines portfolio performance over multiple time periods as sum of terms of form (R - R)(A + ). In all embodiments, the inventive coefficient (A + ) have smaller standard deviation than conventional logarithmic coefficients, which reduces variation in the weights assigned to each time period relative to the other time periods in the attribution calculation. The method to be performed on the computer having a processor (1), an input device (3) and a display (5).
Description
METHOD AND SYSTEM FOR MULTI-PERIOD PERFORMANCE ATTRIBUTION
Technical Field of the Invention
The present invention relates to methods for performing performance attribution to compare the returns of a financial portfolio against those of a benchmark, and attribute the relative performance to various effects resulting from active decisions by the portfolio manager. More particularly, the invention is an improved method for linking single-period attribution effects over multiple periods, using either an arithmetic or a geometric methodology.
Background of the Invention
In performing performance attribution, the returns of a portfolio are compared against those of a benchmark, and the excess return (i.e., relative performance) is attributed to various effects resulting from active decisions by the portfolio managers. Performance attribution is a rich and complex topic, which can be viewed from many angles. There are a variety of conventional methods for performing attribution based on a single-period analysis. However, if performance is measured over an extended length of time, a single-period buy-and-hold analysis may lead to significant errors, especially for highly active portfolios. Therefore, it is imperative to link the single-period attribution effects over multiple periods in an accurate and meaningful way. The two basic approaches that have arisen for such linking are the arithmetic and geometric methodologies. In arithmetic attribution, the performance of a portfolio relative to a benchmark is given by the difference R -R, where R and R refer to portfolio and benchmark returns, respectively. This relative performance, in turn, is decomposed sector by sector into attribution effects that measure how well the portfolio manager weighted the appropriate sectors and selected securities within the sectors. The sum of the attribution effects gives the performance, R -R.
In geometric attribution, by contrast, the relative performance is defined by the ratio (l+R) /(l+R). This relative performance is again decomposed sector by sector into attribution effects. In this case, however, it is the product of the attribution effects that gives the relative performance (1 + R) / (1 + R). A recent example of both arithmetic and geometric attribution systems is described in Carino, "Combining
Attribution Effects Over Time," Journal of Performance Measurement, Summer 1999, pp. 5-14 ("Carino").
An advantage of the arithmetic approach is that it is more intuitive. For instance, if the portfolio return is 21% and the benchmark return is 10%, most people regard the relative performance to be 11%, as opposed to 10%. An advantage of geometric attribution, on the other hand, is the ease with which attribution effects can be linked over time.
Carino describes one possible algorithm for linking attribution effects over time that results in a multi-period arithmetic performance attribution system. Furthermore, the result is residual free in that the sum of the linked attribution effects is exactly equal to the difference in linked returns. Carino discloses an arithmetic performance attribution method which determines portfolio relative performance over multiple time periods as a sum of terms of form (R, - Rt)βt , where the index " t " indicates one time period, and where Carino's coefficients βt are

In accordance with the present invention, new coefficients (A + at) to be defined below replace Carino's coefficients βt (sometimes referred to herein as conventional
"logarithmic" coefficients). The inventive coefficients have a much smaller standard deviation than the conventional logarithmic coefficients. Reducing the standard deviation of the coefficients is important in order to minimize the distortion that arises from overweighting certain periods relative to others.
SUMMARY OF THE INVENTION
In a class of embodiments, the invention is an arithmetic method for determining portfolio relative performance over multiple time periods (t = 1,2,..., T) as a sum of terms of form (R, - Rt)(A + at) , where the coefficients at are defined as

The value of A is preferably

_4 = (l + R)(J-1) r, (R = R), where 7" is the total number of time periods.
The inventive coefficients (A + at) have smaller (and typically much smaller) standard deviation than the conventional logarithmic coefficients (in cases in which A has the preferred value), which reduces variation in the weights assigned to each time period relative to the other time periods in the attribution calculation.
In another class of embodiments, the invention is a geometric method for determining portfolio relative performance over multiple time periods (t = 1,2,...,T) as
where N is the number of sectors, 1 + lt = ± XiLΛ
,1 + Vs y is an attribution effect (issue selection),

In preferred embodiments, the values of Tt z are T and the

values of Tt are Tt = In other embodiments,


More generally, embodiments of the invention include geometric methods for determining portfolio relative performance over multiple time periods (t = 1,2,...,T) as
1 , D T N M = = (1 + Qyt ) 5 where the terms 1 + Q?t are attribution effects given by l + R .=1 i~ι j=\
ι+< , where the terms T - yt are corrective terms that satisfy the
 l + R. constraint ] (1 + O. ) = -
+ R.
The attribution effects employed in preferred embodiments of the inventive geometric attribution method have more natural form than those employed in conventional geometric attribution methods (such as the geometric attribution method of the above- cited Carino paper), since the inventive attribution effects are defined as ratios rather than exponentials. Further, the inventive definitions allow the geometric attribution method to be performed more accurately than the geometric attribution performed using the attribution effects as defined by Carino.
Other aspects of the invention are a computer system programmed to perform any embodiment of the inventive method, and a computer readable medium which stores code for implementing any embodiment of the inventive method.
Brief Description of the Drawings
Figure la is a contour plot of the average logarithmic coefficients, determined in accordance with the prior art, resulting from a set of simulations.
Figure lb is a contour plot of the average inventive coefficients resulting from the same simulations which determined Fig. la.
Figure 2a is plot of normalized standard deviation for the conventional logarithmic coefficients, assuming the same set of distributions that were assumed to generate Figures la and lb.
Figure 2b is plot of normalized standard deviation for the inventive coefficients, assuming the same set of distributions that were assumed to generate Figs, la and lb.
Figure 3 is a block diagram of a computer system for implementing any embodiment of the inventive method. Figure 4 is an elevational view of a computer readable optical disk on which is stored computer code for implementing any embodiment of the inventive method.
Detailed Description of the Preferred Embodiments
The arithmetic performance attribution method of the present invention is an improved approach to arithmetic linking over multiple periods. The methodology described herein is based on an optimal distribution of the residual among the different time periods. Such an approach minimizes the distortion that arises from overweighting certain time periods relative to others. The resulting attribution system is also residual free, robust, and completely general, so that performance can be linked without complication for any set of sector weights and returns.
The geometric performance attribution method of the present invention represents a fundamentally different definition for the geometric attribution effects, since the attribution effects are defined in terms of ratios rather than exponentials. This form, which is more natural, also results in an improved approximation over previous methods.
Single-Period Arithmetic Attribution
The portfolio return R, for a single period t can be written as the weighted average return over N sectors
N
5 = Σ witrit> (2)
.=ι with the overbar denoting the benchmark. The arithmetic measure of relative performance is therefore
N N
Rt - Rt = ∑witrit -∑ y*Xit (3)
(=1 1=1
This difference can be rewritten as

N N
Rt ~Rt = ∑ wft(rΛ - rΛ) + ∑ (wlt - wit)(rit - Rt). (5) ι=l (=1
We interpret the terms in the first summation to be the issue selection tf = wβ(rft -Fft), (6) with the superscript A denoting arithmetic.
The issue selection lt measures how well the portfolio manager picked overperforming securities in sector i during period t.
Similarly, the terms in the second summation of equation (5) we interpret to be the sector selection,
S = (wit -wit)(rit -Rt), (7) which measures the extent to which the manager overweighted the outperforming sectors. The active contribution At is the sum of the issue selection lt and sector selection Sft :
To summarize, the single-period relative performance has been fully decomposed into attribution effects at the sector level. These attribution effects, when summed over all sectors, give the total excess return for the period, Rt -Rt .
Multiple-Period Arithmetic Attribution
It is desirable to extend the above analysis to the multiple-period case. The portfolio and benchmark returns linked over T periods are respectively given by
Just as we define the relative performance for the single-period case by the difference in single-period returns, it is natural to define the relative performance for the multiple-period case as the difference in linked returns, R - R .
If the returns are small, then the relative performance is approximately given by
R -R * ∑(R, -R.) . (11)
(=1
However, this approximation breaks down for large returns. A better approach is to multiply the right side of (11) by a constant factor A that takes into account the characteristic scaling which arises from geometric compounding:
R -R « _4∑(R, -R,) . (12) t=\
An obvious possible choice for A is given by
R -R
(13)
H -**)
However, this naive solution is unacceptable because it does not necessarily reflect the characteristic scaling of the system. Furthermore, it may easily occur that the
numerator and denominator of the above expression have opposite sign, in which case the entire linking process loses its underlying meaning.
The value of A that correctly describes such scaling can be found by substituting the mean geometric return (1 + R)ly,r - 1 for the single-period returns Rt , and similarly for the benchmark. Therefore, in preferred embodiments, A is given by

Note that A satisfies the required property of being always positive. For the special case R = R , it is easy to show that the above expression has limiting value
_4 = (l + R)(r~1) r, (R = R). (15)
In alternative embodiments, A is taken to have some other value. For example, A = 1 or A = [(1 + R)(l + R )]1/2 in alternative embodiments.
Although (12) is a good approximation with A defined by equations (14) and (15), it still leaves a small residual for general sets of returns. However, we can introduce a set of corrective terms at that distribute the residual among the different periods so that the following equation exactly holds
R -R = ∑(A + at)(Rt -Rt) (16) t=\
The problem now reduces to calculating the at . Our objective is to construct a solution for equation (16) that minimizes the distortion arising from overweighting certain periods relative to others. In other words, the at should be chosen to be as small as possible. In order to find the optimal solution, we must minimize the function
f = ∑a , (17)
<=1 subject to the constraint of equation (16). This is a standard problem involving Lagrange multipliers, and the optimal solution is given by

R- R = ∑∑βϊestek(ltt + S?t ) . (20)
(=1 1=1
Observe that our result is fully additive, so that the total performance is defined as a sum of attribution effects, each summed over sectors and time periods. Furthermore, there is no unexplained residual.
The inventor has determined that if one chooses the value of A to be the value determined by equation (14) (or equation (15), if R = R ), the standard deviation of the inventive coefficients of equation (19) is less than that for the logarithmic coefficients disclosed in the above-cited paper by Carino, namely the β^armo of equation (21), in all simulations performed. Thus, this choice for the value of A guarantees smaller standard deviation among the coefficients β estek than among the logarithmic coefficients taught by Carino.
It is interesting to compare the inventive weighting coefficients βt vestek of equation (19) to the logarithmic coefficients disclosed by Carino:

The logarithmic coefficients (21) are similar to their optimized counterparts (19) in that both lead to residual-free linking. However, the logarithmic coefficients tend to overweight periods with lower-than-average returns, and to underweight those with higher-than-average returns. This appears to be an artifact of the linking algorithm, and not to be grounded in any economic principle. The optimized coefficients, by contrast, tend to weight each period as evenly as possible.
We conducted a more detailed analysis comparing the inventive coefficients and the conventional logarithmic coefficients, using computational simulations linking
single-month attribution effects over a twelve-month period. The portfolio and benchmark returns were drawn from normal distributions, with the standard deviation set equal to the absolute value of the mean return. The portfolio and benchmark distributions were kept fixed for the twelve-month period, and each data point was calculated by averaging the linking coefficients over 1000 sample paths drawn from the same fixed distributions. The mean monthly returns were then varied from -10% to +20%), in order to obtain an understanding of the global behavior of the linking coefficients. Typical annual returns varied from -70% on the low end to +800% on the high end. Figures la and lb show results of the simulations, with Fig. la being a contour plot of the average logarithmic coefficients and Fig. lb being a contour plot of the average inventive coefficients. In both cases, the coefficients increase from an average of less than 0.5 for the smallest returns to more than 6.0 for the largest returns. Furthermore, we see that for any combination of portfolio and benchmark returns, the average coefficient is virtually identical in both approaches. Evidently, the reason for this similarity is that the coefficients in the logarithmic algorithm also correctly account for the scaling properties.
A more interesting study, however, is to compare the standard deviation for both sets of coefficients for the same set of returns used in Figures la and lb. We first calculate for a single twelve-month period σ , the percent standard deviation of the linking coefficients normalized by the average linking coefficient (/?} for that twelvemonth period,

We then average σ over 1000 sample paths in order to obtain a good estimate of the average normalized standard deviation of the linking coefficients. The resulting contour plots are presented in Figures 2a and 2b. We observe fundamentally distinct behavior for the two cases. For the logarithmic coefficients, the normalized standard deviation increases in concentric circles about the origin, rising to over 10% for the largest returns considered here. By contrast, the inventive coefficients exhibit valleys of extremely low standard deviation extending along the directions R = ±R . This
property of the inventive coefficients is very appealing because, in the usual case, portfolio returns can be expected to at least roughly track the benchmark returns. In other words, in the usual case, the inventive coefficients have a much smaller standard deviation than the conventional logarithmic coefficients.
Although the results of Figures la, lb, 2a, and 2b were obtained for a twelvemonth period with specific distributions, the inventor has conducted extensive simulations with different periods and different distributions and has found that the results are entirely consistent with those shown in Figures la, lb, 2a, and 2b.
It is natural to ask what kinds of differences might arise in practice between the two sets of linking coefficients. In Table 1 we present a hypothetical set of portfolio and benchmark returns for a six-month period, together with the resulting linking coefficients for the logarithmic and optimized cases. We note that the standard deviation of the optimized coefficients is very small, with the coefficients ranging from roughly 1.41 to 1.42. For the logarithmic case, on the other hand, the coefficients range from 1.26 to 1.54. The linked portfolio and benchmark returns for this example are 64.37%) and 39.31%, respectively, for an excess return of 25.06%. h Table 1 we also decompose the single-period relative performance into issue selection if and sector selection Sf , where these attribution effects represent the total summed over all sectors. The values were specifically chosen for illustrative purposes with the average single-period issue selection and sector selection being equal. Applying the logarithmic linking algorithm, we find that the linked issue selection is 10.88%, and that the linked sector selection is 14.18%. Using the optimized coefficients, the corresponding values are 12.52%) and 12.54%, respectively. In both cases, the issue selection and sector selection add to give the correct relative performance of 25.06%, so that there is no residual in either method. However, the optimized approach more accurately reflects the fact that, on average, the issue selection and sector selection were equal.
Table 1 Comparison of the logarithmic (βf"""0) and optimized (βfestek) coefficients for a hypothetical six-month period. Portfolio and benchmark returns are given by R, and R, , respectively. Also presented are the single-period issue selection if and sector selection Sf .
Period t R, (%)

1 10.0 5.0 1.409496 1.412218 2.0 3.0
2 25.0 15.0 1.263177 1.410606 9.0 1.0
3 10.0 20.0 1.318166 1.417053 -2.0 -8.0
4 -10.0 10.0 1.520015 1.420276 -13.0 -7.0
5 5.0 -8.0 1.540243 1.409639 3.0 10.0
6 15.0 -5.0 1.447181 1.407383 10.0 10.0
Single-Period Geometric Attribution
In the geometric approach, the relative performance for period t is given by the ratio
l + R, (23) l + R
One of the nice features of geometric attribution is the natural way in which the attribution effects link over multiple periods. In order to fully exploit this characteristic, however, the geometric attribution system should exactly mirror the arithmetic system. In other words, just as attribution effects are combined arithmetically in terms of summations, they should be combined geometrically in terms of products.
Carino defines the geometric attribution effects in terms of an exponential function of the corresponding arithmetic attribution effect multiplied by a corrective factor kt . For instance, using the Carino approach, the geometric issue selection would be defined by l + !° = exp( ,) , (24)
where if is given by equation (6), kt is given by
k _ ln(l + R,) -ln(l + R TT,N)Λ
(25)
Rt -Rt and the superscript G denotes "geometric." Similarly, the geometric sector selection in the Carino picture is
 with Sf given by equation (7).
However, just as geometric relative performance is defined in terms of a ratio, we believe it is more natural to define the geometric attribution effects also in terms of ratios. With this in mind, we define the geometric issue select i 'Vestek for sector i and period t by

Tt , which plays a role equivalent to Carino's kt , is given by

1 +

It is easy to verify that for the case of small returns, Tt approaches unity and that jG.vestek ^ gG,ve S tek approach their arithmetic counte arts, if and S^ , respectively.
This property, which is shared by the Carino attribution effects, is required in order to preserve the intrinsic meaning from the familiar arithmetic definitions.
The total geometric issue selection lf'Vestek for period t is defined in terms of the product of the contributions over all sectors
1 + If'¥estek = f[(l + Ift 'vestek) , (30) ϊ=l
The total geometric sector selection St ' es e for period t is given by the product
H ι,ι.ι- ι( ,.- ιf, ,„„if it,„!f ,„«(, •.•■ ""ir,.,ifc „;;» if,„ιr .
-14-
1 + S 'Vestek = π (1 + S, eite* ) • (31) ι=l
The geometric active contribution Af'Vestek for sector i and period t is
1 + A estek = (1 + If estek)(l + Sf estek), (32) in analogy with the arithmetic case. Similarly, the total geometric active contribution G,ve tek ^oχ period t is given by
1 + G,Vestek = JTfl + J« «)(1 + S 6"* = ^S- . (33)
,=1 l + R,
Equation (33) is the fully geometric analog of equation (9).
Multiple-Period Geometric Attribution
One of the strong features of geometric attribution is the ease with which linking can be accomplished over multiple time periods. The linked relative performance follows immediately from the single-period definitions,

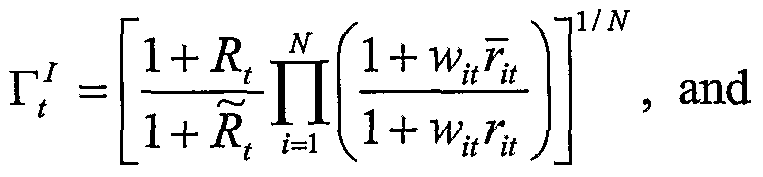
= πΪTN 1 + I?'ra**)Q- + S°>Vestek). (35) l + R ,=ι w where lf estek is defined in equation (27) and SfVestek is defined in equation (29).
Equation (35) is the fully geometric analog of equation (20). In the Carino approach, the corresponding result is given by
l±! .= πf[(l + Iff Cfl""°)(l + S 'Carl"°) , (36) l + R t=l !=1 with l Carim and Sft 'Carino given by equations (24) and (26) respectively.
The attribution effects defined in preferred embodiments of the inventive geometric attribution method (including the embodiment to be described with reference to equations (42)-(49)) have more natural form than the conventional attribution effects (such as those employed in the geometric attribution method of the above-cited Carino
paper), since the inventive attribution effects are defined as ratios rather than exponentials.
Further, the mventive attribution effects allow the inventive geometric attribution method to be performed more accurately than geometric attribution performed using the Carino approach. This can be established quantitatively by recognizing that the basic approximation involved is found by setting the corrective factors kt and Ft equal to unity. In other words, the approximation involved in the Carino method is
^ * exp(R, -R;) . (37) l + R,
Therefore, the corresponding error term resulting from geometric attribution using the Carino method is
_

For the inventive geometric method, the basic approximation (Tt = 1) is
l + R, U α + wftrft)(l + wΛ) ' The corresponding error term in the inventive approach is therefore .,., =r 2" -ι. (40)
In order to obtain an analytic expression for equation (40), we assume that the benchmark returns are equal to zero (rit = 0), and that the portfolio weights and returns are evenly distributed (i.e., rkt = rJt for all k andj, and wjt = 11 N for all ). In this special case the error of the approximation is given by
srM X + R 1 + κ-t « + RX (41) where N is the number of sectors. With these expressions for the error terms, it is easy to establish that the worst-case error resulting from the inventive attribution effects (which occurs in the limit as N approaches mfinity) is equal to the error resulting from the Carino definitions. Monte Carlo simulations also establish that the error resulting from the inventive attribution effects for general sets of weights and returns is consistently smaller than the error resulting from the Carino definitions.
The general idea behind the geometric attribution methodology presented herein is that the attribution effects should be defined in terms of the appropriate ratio multiplied by a small correction factor that ensures that the product of all attribution effects over all sectors gives exactly the geometric relative performance. Within this constraint, there is considerable freedom in choosing the correction factors. For instance, another good definition for the geometric issue selection is
The aggregate geometric issue selection, found by multiplying over all sectors, is
Therefore, Tf is given by

Similarly, we define our geometric sector selection as


^=π +^)=(i+^,G)(i+^) (49) i + -^, ,=1 (i+^)(i
Clearly, the above results can be generalized. Let the excess return for period t , Rt -Rt , be decomposed into arithmetic attribution effects Qft , where i denotes the sector, j denotes the attribution effect, and the superscript A denotes arithmetic. Hence,

'7
The attribution effect can be written as a sum of differences,
For instance, if Qft is issue selection, then k = 1,1 and a) = wltrlt , and b)Jt = wltrlt . The corresponding geometric attribution effect can now be written as

The corrective terms Tk t must satisfy the constraint
The computer system of Figure 3 includes processor 1, input device 3 coupled to processor 1, and display device 5 coupled to processor 1. Processor 1 is programmed to implement the inventive method in response to instructions and data entered by user manipulation of input device 3. Computer readable optical disk 7 of Fig. 4 has computer code stored thereon. This code is suitable for programming processor 1 to implement an embodiment of the inventive method.
Although the invention has been described in connection with specific preferred embodiments, various modifications of and variations on the described methods and apparatus of the invention will be apparent to those skilled in the art without departing from the scope and spirit of the invention. For example, in variations of the above- described embodiments, the effects of currency fluctuations in a global portfolio are accounted for.
Claims
WHAT IS CLAIMED IS:
1. An arithmetic performance attribution method for determining portfolio performance, relative to a benchmark, over multiple time periods t, where t varies from 1 to T, comprising the steps of: (a) determining coefficients (A + af) , where the values at are defined as

(b) deteπnining the portfolio performance as
R -R = ∑(A + at)(Rt - Rt) .
,=1
2. The method of claim 1, wherein A is
(R - R) vvbere R ≠ R ,
T (l + R)1/r - (l + R) l/r
or for the special case R = R :
_4 = (l + R)(r"1)/r.
3. The method of claim 1, wherein A = 1.
4. The method of claim 1, wherein step (b) is performed by determining the portfolio performance as
.-.. s ., „„ ,„ ,„„„ „. wl i « „ .,>-
-19-
5. A computer system, comprising: a processor programmed to perform an arithmetic performance attribution computation to determine portfolio performance, relative to a benchmark, over multiple time periods t, where t varies from 1 to T, by determining coefficients (A + af) , where the values a, are defined as

— τ _
R -R = ∑(_4 + α,)(R, -R() ; and
,=1 a display device coupled to the processor for displaying a result of the arithmetic performance attribution computation.
6. A computer readable medium which stores code for programming a processor to perform an arithmetic performance attribution computation to determine portfolio performance, relative to a benchmark, over multiple time periods t, where t varies from 1 to T, by determining coefficients (A + af) , where the values at are defined as
 where A has any predetermined value, Rt is a portfolio return for period t, Rt is a benchmark return for period t, R is determined by
,=1
7. A geometric performance attribution method for determining portfolio performance, relative to a benclimark, over multiple time periods t, where t varies from 1 to T, comprising the steps of: determining attribution effects for issue selection (1 + 1° ) given by
i+π rff = + ^ ιt u rτJ
1 + WΛ and determining attribution effects for sector selection (1 + S?t ) given by

where rjt is a portfoho return for sectory for period t, rjt is a benchmark return for sector
j for period t, wjt is a weight for rjt , wjt is a weight for r]t , R is determined by
l + R t=1 ,-_.-
8. The method of claim 7, wherein the values of Tt l are

T ^ϊ
The method of claim 7, wherein the values of Yt and Tt are

10. A computer system, comprising: a processor programmed to perform a geometric performance attribution computation to determine portfolio performance, relative to a benchmark, over multiple time periods t, where t varies from 1 to T, by determining attribution effects for issue selection (1 + /^) given by
1 + J 1 + WΛ l + witr —it L t
and determining attribution effects for sector selection (1 + Sf ) given by

where r/t is a portfoho return for sector/ for period t, rjt is a benchmark return for sector
j for period t, wjt is a weight for rJt , wjt is a weight for r.( , R is determined by
and a display device coupled to the processor for displaying a result of the geometric performance attribution computation.
11. The system of claim 10, wherein the values of Tt I are
and the values of are


12. A computer readable medium which stores code for programming a processor to perform a geometric performance attribution computation to determine portfolio performance, relative to a benchmark, over multiple time periods t, where t varies from 1 to T, by determining attribution effects for issue selection (1 + lt ) given by
i + - r l- + wy —ft 1. >
and determining attribution effects for sector selection (1 + S^) given by

j for period t, wjt is a weight for rjt , wjt is a weight for r.t , R is determined by
 and R is determined by
R = [J^[ (1 + R, )] - 1 ; and determining the portfoho performance as
,=ι
13. The computer readable medium of claim 12, wherein the values of Tt 1 are
r and the values of T, are


14. A geometric performance attribution method for deterπiining portfoho performance, relative to a benchmark, over multiple time periods t, where t varies from 1 to T, comprising the steps of: determining attribution effects 1 + Q given by

benchmark return for period t, where R is determined by
15. The method of claim 14, wherein M = 2, l + Q?u are attribution effects for
issue election given by 1 + Qlt = " r , and l + OJ are attribution effects for
1 + w„r..
sector selection given by 1 + Q 2t
 where rit is a portfolio return for sector i for period t, rit is a benchmark return for sector
i for period t, wit is a weight for rit , wu is a weight for rlt , the values of Tt 1 are

the values of Tt are Ft

16. A computer system, comprising: a processor programmed to perform a geometric performance attribution computation to determine portfolio performance, relative to a benchmark, over multiple time periods t, where t varies from 1 to T, by determining attribution effects 1 + Q?t given
by

benchmark return for period t, R is detennined by
R =[π ,=1 α+ R,)]-ι and R is determined by
17. The system of claim 16, wherein M = 2, 1 + Qfu are attribution effects for
issue election given by 1 + Qoϊt _ =
 > and 1 + Qf2t are attribution effects for l + w«rft
sector selection given by 1 + Q?2t
 where rit is a portfolio return for sector i for period t, rlt is a benchmark return for sector
i for period t, wit is a weight for rr.( , wit is a weight for rit , the values of Tt 1 are

the values of Tf are T'

18. A computer readable medium which stores code for progranm ing a processor to perform a geometric performance attribution computation to determine portfolio performance, relative to a benchmark, over multiple time periods t, where t varies from 1 to T, by deteirnining attribution effects 1 + Q?t given by

a yt an ,dA bk ,., is a coefficient for attribution effect j, sector i, and period t, Rt is a portfolio return for period t, the coefficients aJ k t and bj k t are obtained from arithmetic attribution effects Qft = aj k t - bj k t wliich correspond to the attribution effects 1 + Qfjt , R, is a
/. k
T benchmark return for period t, R is determined by R = [J^[ (1 + R, )] - 1 , and R is
,=1 _ T _ determined by R = [T [(l + R,)] - 1 , and determining the portfolio performance as
,=ι l + R N M l + R =π ,=1 π ,-=i π ;=ι α+Φ-
19. The computer readable medium of claim 18, wherein M = 2, 1 + Qfu are
attribution effects for issue election given by 1 + Q?lt are

- l + w,R^ attribution effects for sector selection given by 1 + Q2t = — XX
X + wi t j l + witRt T!>
where rit is a portfolio return for sector i for period t, rit is a benchmark return for sector
i for period t, wit is a weight for rit , wit is a weight for rit , the values of Tt l are
the values of

Priority Applications (1)
| Application Number | Priority Date | Filing Date | Title |
|---|---|---|---|
| AU2001281302A AU2001281302A1 (en) | 2000-07-11 | 2001-07-09 | Method and system for multi-period performance attribution |
Applications Claiming Priority (4)
| Application Number | Priority Date | Filing Date | Title |
|---|---|---|---|
| US09/613,855 | 2000-07-11 | ||
| US09/613,855 US7249079B1 (en) | 2000-07-11 | 2000-07-11 | Method and system for multi-period performance attribution |
| US09/698,693 US7246091B1 (en) | 2000-07-11 | 2000-10-27 | Method and system for multi-period performance attribution |
| US09/698,693 | 2000-10-27 |
Publications (2)
| Publication Number | Publication Date |
|---|---|
| WO2002005066A2 true WO2002005066A2 (en) | 2002-01-17 |
| WO2002005066A3 WO2002005066A3 (en) | 2002-04-04 |
Family
ID=27087102
Family Applications (1)
| Application Number | Title | Priority Date | Filing Date |
|---|---|---|---|
| PCT/US2001/041307 WO2002005066A2 (en) | 2000-07-11 | 2001-07-09 | Method and system for multi-period performance attribution |
Country Status (3)
| Country | Link |
|---|---|
| US (2) | US7246091B1 (en) |
| AU (1) | AU2001281302A1 (en) |
| WO (1) | WO2002005066A2 (en) |
Cited By (1)
| Publication number | Priority date | Publication date | Assignee | Title |
|---|---|---|---|---|
| US7890408B2 (en) | 2007-10-11 | 2011-02-15 | Morgan Stanley Capital International, Inc. | System and method for attributing performance, risk and risk-adjusted performance of an investment portfolio to custom factors |
Families Citing this family (20)
| Publication number | Priority date | Publication date | Assignee | Title |
|---|---|---|---|---|
| US7340431B1 (en) * | 2001-07-30 | 2008-03-04 | Federal Home Loan Mortgage Corporation (Freddie Mac) | Systems and methods for determining the value of assets |
| US7640201B2 (en) | 2003-03-19 | 2009-12-29 | General Electric Company | Methods and systems for analytical-based multifactor Multiobjective portfolio risk optimization |
| US20040186804A1 (en) * | 2003-03-19 | 2004-09-23 | Anindya Chakraborty | Methods and systems for analytical-based multifactor multiobjective portfolio risk optimization |
| US7593880B2 (en) * | 2003-03-19 | 2009-09-22 | General Electric Company | Methods and systems for analytical-based multifactor multiobjective portfolio risk optimization |
| US8219477B2 (en) * | 2004-02-20 | 2012-07-10 | General Electric Company | Systems and methods for multi-objective portfolio analysis using pareto sorting evolutionary algorithms |
| US7630928B2 (en) * | 2004-02-20 | 2009-12-08 | General Electric Company | Systems and methods for multi-objective portfolio analysis and decision-making using visualization techniques |
| US7542932B2 (en) * | 2004-02-20 | 2009-06-02 | General Electric Company | Systems and methods for multi-objective portfolio optimization |
| US8126795B2 (en) * | 2004-02-20 | 2012-02-28 | General Electric Company | Systems and methods for initial sampling in multi-objective portfolio analysis |
| US7469228B2 (en) * | 2004-02-20 | 2008-12-23 | General Electric Company | Systems and methods for efficient frontier supplementation in multi-objective portfolio analysis |
| US20060074707A1 (en) * | 2004-10-06 | 2006-04-06 | Schuette Thomas A | Method and system for user management of a fleet of vehicles including long term fleet planning |
| US7685063B2 (en) | 2005-03-25 | 2010-03-23 | The Crawford Group, Inc. | Client-server architecture for managing customer vehicle leasing |
| US20060265235A1 (en) * | 2005-05-12 | 2006-11-23 | The Crawford Group, Inc. | Method and system for managing vehicle leases |
| US8150725B2 (en) * | 2008-10-31 | 2012-04-03 | At&T Intellectual Property I, Lp | Method and system of multidimensional attribution analysis of telecommunication services distribution |
| US8224734B2 (en) * | 2009-03-07 | 2012-07-17 | Bastgone, LLC | Financial risk cover analysis, modeling control and monitoring system |
| US10475123B2 (en) | 2014-03-17 | 2019-11-12 | Chicago Mercantile Exchange Inc. | Coupon blending of swap portfolio |
| US10319032B2 (en) | 2014-05-09 | 2019-06-11 | Chicago Mercantile Exchange Inc. | Coupon blending of a swap portfolio |
| US10810671B2 (en) * | 2014-06-27 | 2020-10-20 | Chicago Mercantile Exchange Inc. | Interest rate swap compression |
| EP3016058A1 (en) | 2014-10-31 | 2016-05-04 | Chicago Mercantile Exchange, Inc. | Generating a blended fx portfolio |
| US10609172B1 (en) | 2017-04-27 | 2020-03-31 | Chicago Mercantile Exchange Inc. | Adaptive compression of stored data |
| US11907207B1 (en) | 2021-10-12 | 2024-02-20 | Chicago Mercantile Exchange Inc. | Compression of fluctuating data |
Citations (6)
| Publication number | Priority date | Publication date | Assignee | Title |
|---|---|---|---|---|
| US5761442A (en) * | 1994-08-31 | 1998-06-02 | Advanced Investment Technology, Inc. | Predictive neural network means and method for selecting a portfolio of securities wherein each network has been trained using data relating to a corresponding security |
| US5930762A (en) * | 1996-09-24 | 1999-07-27 | Rco Software Limited | Computer aided risk management in multiple-parameter physical systems |
| US6021397A (en) * | 1997-12-02 | 2000-02-01 | Financial Engines, Inc. | Financial advisory system |
| US6078904A (en) * | 1998-03-16 | 2000-06-20 | Saddle Peak Systems | Risk direct asset allocation and risk resolved CAPM for optimally allocating investment assets in an investment portfolio |
| US6175824B1 (en) * | 1999-07-14 | 2001-01-16 | Chi Research, Inc. | Method and apparatus for choosing a stock portfolio, based on patent indicators |
| US6249775B1 (en) * | 1997-07-11 | 2001-06-19 | The Chase Manhattan Bank | Method for mortgage and closed end loan portfolio management |
Family Cites Families (1)
| Publication number | Priority date | Publication date | Assignee | Title |
|---|---|---|---|---|
| US5918217A (en) * | 1997-12-10 | 1999-06-29 | Financial Engines, Inc. | User interface for a financial advisory system |
-
2000
- 2000-10-27 US US09/698,693 patent/US7246091B1/en not_active Expired - Lifetime
-
2001
- 2001-05-03 US US09/848,741 patent/US7249082B2/en not_active Expired - Lifetime
- 2001-07-09 WO PCT/US2001/041307 patent/WO2002005066A2/en active Application Filing
- 2001-07-09 AU AU2001281302A patent/AU2001281302A1/en not_active Abandoned
Patent Citations (6)
| Publication number | Priority date | Publication date | Assignee | Title |
|---|---|---|---|---|
| US5761442A (en) * | 1994-08-31 | 1998-06-02 | Advanced Investment Technology, Inc. | Predictive neural network means and method for selecting a portfolio of securities wherein each network has been trained using data relating to a corresponding security |
| US5930762A (en) * | 1996-09-24 | 1999-07-27 | Rco Software Limited | Computer aided risk management in multiple-parameter physical systems |
| US6249775B1 (en) * | 1997-07-11 | 2001-06-19 | The Chase Manhattan Bank | Method for mortgage and closed end loan portfolio management |
| US6021397A (en) * | 1997-12-02 | 2000-02-01 | Financial Engines, Inc. | Financial advisory system |
| US6078904A (en) * | 1998-03-16 | 2000-06-20 | Saddle Peak Systems | Risk direct asset allocation and risk resolved CAPM for optimally allocating investment assets in an investment portfolio |
| US6175824B1 (en) * | 1999-07-14 | 2001-01-16 | Chi Research, Inc. | Method and apparatus for choosing a stock portfolio, based on patent indicators |
Cited By (1)
| Publication number | Priority date | Publication date | Assignee | Title |
|---|---|---|---|---|
| US7890408B2 (en) | 2007-10-11 | 2011-02-15 | Morgan Stanley Capital International, Inc. | System and method for attributing performance, risk and risk-adjusted performance of an investment portfolio to custom factors |
Also Published As
| Publication number | Publication date |
|---|---|
| US7246091B1 (en) | 2007-07-17 |
| US7249082B2 (en) | 2007-07-24 |
| WO2002005066A3 (en) | 2002-04-04 |
| US20020038272A1 (en) | 2002-03-28 |
| AU2001281302A1 (en) | 2002-01-21 |
Similar Documents
| Publication | Publication Date | Title |
|---|---|---|
| WO2002005066A2 (en) | Method and system for multi-period performance attribution | |
| US7412414B2 (en) | Portfolio rebalancing by means of resampled efficient frontiers with forecast confidence level | |
| Hull et al. | A methodology for assessing model risk and its application to the implied volatility function model | |
| Jandačka et al. | On the risk-adjusted pricing-methodology-based valuation of vanilla options and explanation of the volatility smile | |
| WO2003096254A1 (en) | A method and system to solve dynamic multi-factor models in finance | |
| Gurrola-Perez et al. | Filtered historical simulation Value-at-Risk models and their competitors | |
| Crouhy et al. | Measuring risk-adjusted performance | |
| US7698196B1 (en) | Method and system for modeling and benchmarking private equity and applications of same | |
| Lambertini et al. | Macroeconomic implications of bank capital requirements | |
| Bossone et al. | In finance, size matters | |
| Han et al. | An extended CreditRisk+ framework for portfolio credit risk management | |
| Gibson et al. | Improving grid-based methods for estimating value at risk of fixed-income portfolios | |
| US7249079B1 (en) | Method and system for multi-period performance attribution | |
| Tsay | Autoregressive conditional duration models | |
| Duarte et al. | The systemic effects of benchmarking | |
| Koyluoglu et al. | Devil in the Parameters | |
| Rezaie | Empirical analysis of value-at-risk models in the S&P 500's most and least volatile sectors during the COVID-19 pandemic | |
| Engle | ARCH/GARCH Models in Applied | |
| Trainor | Long-range confidence interval projections and probability estimates | |
| Grassi | Valutation risk in margin loan pricing | |
| Ganesan et al. | Estimating future value-at-risk from value samples, and applications to future initial margin | |
| Houllier et al. | Borderline: judging the adequacy of return distribution estimation techniques in initial margin models | |
| Gurrola-Perez et al. | The Impulsive Approach to Procyclicality. Measuring the Reactiveness of Risk-based Initial Margin Models to Changes in Market Conditions Using Impulse Response Functions | |
| Mei | The design of pension contracts: on the perspective of customers | |
| Lambertini et al. | Bank capital requirements |
Legal Events
| Date | Code | Title | Description |
|---|---|---|---|
| AK | Designated states |
Kind code of ref document: A2 Designated state(s): AU CA JP |
|
| AL | Designated countries for regional patents |
Kind code of ref document: A2 Designated state(s): AT BE CH CY DE DK ES FI FR GB GR IE IT LU MC NL PT SE TR |
|
| 121 | Ep: the epo has been informed by wipo that ep was designated in this application | ||
| AK | Designated states |
Kind code of ref document: A3 Designated state(s): AU CA JP |
|
| AL | Designated countries for regional patents |
Kind code of ref document: A3 Designated state(s): AT BE CH CY DE DK ES FI FR GB GR IE IT LU MC NL PT SE TR |
|
| DFPE | Request for preliminary examination filed prior to expiration of 19th month from priority date (pct application filed before 20040101) | ||
| 122 | Ep: pct application non-entry in european phase | ||
| NENP | Non-entry into the national phase |
Ref country code: JP |