US9658917B2 - Server performance correction using remote server actions - Google Patents
Server performance correction using remote server actions Download PDFInfo
- Publication number
- US9658917B2 US9658917B2 US14/175,945 US201414175945A US9658917B2 US 9658917 B2 US9658917 B2 US 9658917B2 US 201414175945 A US201414175945 A US 201414175945A US 9658917 B2 US9658917 B2 US 9658917B2
- Authority
- US
- United States
- Prior art keywords
- performance issue
- nodes
- node associated
- detected performance
- detected
- Prior art date
- Legal status (The legal status is an assumption and is not a legal conclusion. Google has not performed a legal analysis and makes no representation as to the accuracy of the status listed.)
- Active
Links
Images


Classifications
-
- G—PHYSICS
- G06—COMPUTING; CALCULATING OR COUNTING
- G06F—ELECTRIC DIGITAL DATA PROCESSING
- G06F11/00—Error detection; Error correction; Monitoring
- G06F11/07—Responding to the occurrence of a fault, e.g. fault tolerance
- G06F11/0703—Error or fault processing not based on redundancy, i.e. by taking additional measures to deal with the error or fault not making use of redundancy in operation, in hardware, or in data representation
- G06F11/0793—Remedial or corrective actions
-
- G—PHYSICS
- G06—COMPUTING; CALCULATING OR COUNTING
- G06F—ELECTRIC DIGITAL DATA PROCESSING
- G06F11/00—Error detection; Error correction; Monitoring
- G06F11/07—Responding to the occurrence of a fault, e.g. fault tolerance
- G06F11/0703—Error or fault processing not based on redundancy, i.e. by taking additional measures to deal with the error or fault not making use of redundancy in operation, in hardware, or in data representation
- G06F11/0706—Error or fault processing not based on redundancy, i.e. by taking additional measures to deal with the error or fault not making use of redundancy in operation, in hardware, or in data representation the processing taking place on a specific hardware platform or in a specific software environment
- G06F11/0709—Error or fault processing not based on redundancy, i.e. by taking additional measures to deal with the error or fault not making use of redundancy in operation, in hardware, or in data representation the processing taking place on a specific hardware platform or in a specific software environment in a distributed system consisting of a plurality of standalone computer nodes, e.g. clusters, client-server systems
-
- G—PHYSICS
- G06—COMPUTING; CALCULATING OR COUNTING
- G06F—ELECTRIC DIGITAL DATA PROCESSING
- G06F11/00—Error detection; Error correction; Monitoring
- G06F11/07—Responding to the occurrence of a fault, e.g. fault tolerance
- G06F11/0703—Error or fault processing not based on redundancy, i.e. by taking additional measures to deal with the error or fault not making use of redundancy in operation, in hardware, or in data representation
- G06F11/0706—Error or fault processing not based on redundancy, i.e. by taking additional measures to deal with the error or fault not making use of redundancy in operation, in hardware, or in data representation the processing taking place on a specific hardware platform or in a specific software environment
- G06F11/0748—Error or fault processing not based on redundancy, i.e. by taking additional measures to deal with the error or fault not making use of redundancy in operation, in hardware, or in data representation the processing taking place on a specific hardware platform or in a specific software environment in a remote unit communicating with a single-box computer node experiencing an error/fault
-
- G—PHYSICS
- G06—COMPUTING; CALCULATING OR COUNTING
- G06F—ELECTRIC DIGITAL DATA PROCESSING
- G06F11/00—Error detection; Error correction; Monitoring
- G06F11/07—Responding to the occurrence of a fault, e.g. fault tolerance
- G06F11/0703—Error or fault processing not based on redundancy, i.e. by taking additional measures to deal with the error or fault not making use of redundancy in operation, in hardware, or in data representation
- G06F11/079—Root cause analysis, i.e. error or fault diagnosis
-
- G—PHYSICS
- G06—COMPUTING; CALCULATING OR COUNTING
- G06F—ELECTRIC DIGITAL DATA PROCESSING
- G06F11/00—Error detection; Error correction; Monitoring
- G06F11/30—Monitoring
- G06F11/34—Recording or statistical evaluation of computer activity, e.g. of down time, of input/output operation ; Recording or statistical evaluation of user activity, e.g. usability assessment
- G06F11/3409—Recording or statistical evaluation of computer activity, e.g. of down time, of input/output operation ; Recording or statistical evaluation of user activity, e.g. usability assessment for performance assessment
-
- H—ELECTRICITY
- H04—ELECTRIC COMMUNICATION TECHNIQUE
- H04L—TRANSMISSION OF DIGITAL INFORMATION, e.g. TELEGRAPHIC COMMUNICATION
- H04L67/00—Network arrangements or protocols for supporting network services or applications
- H04L67/01—Protocols
- H04L67/02—Protocols based on web technology, e.g. hypertext transfer protocol [HTTP]
-
- H04L67/22—
-
- H—ELECTRICITY
- H04—ELECTRIC COMMUNICATION TECHNIQUE
- H04L—TRANSMISSION OF DIGITAL INFORMATION, e.g. TELEGRAPHIC COMMUNICATION
- H04L67/00—Network arrangements or protocols for supporting network services or applications
- H04L67/50—Network services
- H04L67/535—Tracking the activity of the user
-
- G—PHYSICS
- G06—COMPUTING; CALCULATING OR COUNTING
- G06F—ELECTRIC DIGITAL DATA PROCESSING
- G06F11/00—Error detection; Error correction; Monitoring
- G06F11/30—Monitoring
- G06F11/34—Recording or statistical evaluation of computer activity, e.g. of down time, of input/output operation ; Recording or statistical evaluation of user activity, e.g. usability assessment
- G06F11/3466—Performance evaluation by tracing or monitoring
- G06F11/3495—Performance evaluation by tracing or monitoring for systems
-
- G—PHYSICS
- G06—COMPUTING; CALCULATING OR COUNTING
- G06F—ELECTRIC DIGITAL DATA PROCESSING
- G06F2201/00—Indexing scheme relating to error detection, to error correction, and to monitoring
- G06F2201/815—Virtual
-
- G—PHYSICS
- G06—COMPUTING; CALCULATING OR COUNTING
- G06F—ELECTRIC DIGITAL DATA PROCESSING
- G06F2201/00—Indexing scheme relating to error detection, to error correction, and to monitoring
- G06F2201/87—Monitoring of transactions
Definitions
- Web services may be provided by a web application which uses one or more services to handle a transaction.
- the applications may be distributed over several machines, making the topology of the machines that provides the service more difficult to track and monitor.
- Monitoring a web application helps to provide insight regarding bottle necks in communication, communication failures and other information regarding performance of the services that provide the web application.
- most systems detect a problem with a particular machine, they attempt to fix the problem at that particular machine.
- the problem with a machine may not be completely fixed by restarting or applying some other fix to the machine at which the problem is detected.
- the present technology may monitor business transactions and the nodes processing the transactions. Actions may be applied to one or more nodes when a performance issue is detected.
- a performance issue may relate to a metric associated with a transaction or node that processes the transaction. If a performance metric determined from data captured by monitoring does not satisfy a health rule, the policy determines which action should be performed to correct the performance of the node.
- the corrective action may be applied to a node other than the node at which the performance metric is associated with. For example, if a performance metric for a first node does not satisfy a threshold, the corrective action may be applied to a second node. When a solution applied to a second node is found to correct the problem in first node, the solution may be applied to the other nodes experiencing the same problem.
- An embodiment may include a method for monitoring a business transaction. A determination may be made that a performance data value associated with a first node of a distributed server system do not satisfy a threshold. A second node of the distributed server system may be selected at which to apply a first corrective action based on the performance data value associated with the first node. The first corrective action may be applied to the second node.
- An embodiment may include a system for monitoring a business transaction.
- the system may include a processor, a memory and one or more modules stored in memory and executable by the processor.
- the one or more modules may determine that a performance data value associated with a first node of a distributed server system do not satisfy a threshold, select a second node of the distributed server system at which to apply a first corrective action based on the performance data value associated with the first node, and apply the first corrective action to the second node.
- FIG. 1 is a system for monitoring and managing application performance.
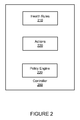
- FIG. 2 is a block diagram of a controller.
- FIG. 3 is an exemplary flowchart for managing application performance.
- FIG. 4 is an exemplary flowchart for applying a corrective actions to a node.
- FIG. 5 is a block diagram of a computer system for implementing the present technology.
- FIG. 6 is a block diagram of an exemplary mobile device for implementing the present technology.
- a performance issue may relate to a performance data value, such as a metric associated with a transaction or node that processes the transaction, an error, or other value.
- a performance data value such as a metric associated with a transaction or node that processes the transaction, an error, or other value.
- a controller may receive data captured and transmitted to the controller by one or more agents located on each of several distributed application servers.
- the controller may include a set of health rules, policies, and actions. If a performance metric determined from the captured data does not satisfy a health rule, the policy determines which action should be performed to correct the performance of the node.
- a node may include any entity that runs software which is relevant to an application being monitored.
- a node may be a server, a virtual machine, or other entity.
- a cluster is a group of nodes relating to a singular purpose or function, such as for example a group of servers that process a particular web service request (e.g., a “check-out” function on an ecommerce site). Actions may be applied to a node that processes a distributed application other than the node from which data is captured and for which the captured data does not satisfy a health rule.
- Actions may be applied by agents located at or in communication with the node.
- agents located at or in communication with the node.
- a machine agent may reside on a server, may monitor basic hardware and software metrics, and may perform basic instructions to the server. Examples of measurements taken by a machine agent include memory usage, processor usage, and other metrics.
- Other agents may include a java agent or a PHP agent, each of which may be utilized to collect data, instrument code at the application server on which they are installed, execute business logic, and other functionality.
- FIG. 1 is an exemplary system for monitoring business transactions.
- System 100 of FIG. 1 includes client devices 105 and 192 , mobile device 115 , network 120 , network server 125 , application servers 130 , 140 , 150 and 160 , asynchronous network machine 170 , data stores 180 and 185 , controller 190 , and data collection server 195 .
- Client device 105 may include network browser 110 and be implemented as a computing device, such as for example a laptop, desktop, workstation, or some other computing device.
- Network browser 110 may be a client application for viewing content provided by an application server, such as application server 130 via network server 125 over network 120 .
- Network browser 110 may include agent 112 .
- Agent 112 may be embedded, installed or otherwise provided on network browser 110 and/or client 105 , for example as a network browser add-on, downloading the agent to the network browser as part of HTML, or in some other manner.
- Agent 112 may be executed to monitor network browser 110 , the operation system of client 105 , and any other application, API, or other component of client 105 .
- Agent 112 may determine network browser navigation timing metrics, access browser cookies, and transmit data to data collection 160 , controller 190 , or another device. Agent 112 may perform other operations related to monitoring a request at client 105 as discussed herein.
- Mobile device 115 is connected to network 120 and may be implemented as a portable device suitable for receiving content over a network, such as for example a mobile phone, smart phone, or other portable device. Both client device 105 and mobile device 115 may include hardware and/or software configured to access a web service provided by network server 125 .
- Mobile device 115 may include network browser 117 and an agent 119 .
- Agent 119 may reside in and/or communicate with network browser 117 , as well as communicate with other applications, an operating system, APIs and other hardware and software on mobile device 115 .
- Agent 119 may have similar functionality as that described herein for agent 112 on client 105 , and may repot data to data collection server 160 and/or controller 190 .
- Network 120 may facilitate communication of data between different servers, devices and machines.
- the network may be implemented as a private network, public network, intranet, the Internet, a Wi-Fi network, cellular network, or a combination of these networks.
- Network server 125 is connected to network 120 and may receive and process requests received over network 120 .
- Network server 125 may be implemented as one or more servers implementing a network service.
- network server 125 may be implemented as a web server.
- Network server 125 and application server 130 may be implemented on separate servers and machines or the same server and/or machine.
- Application server 130 may communicate with every device, server and machine illustrated in FIG. 1 (some connections not shown in FIG. 1 ), as well as other machines that may or may not be implemented in a network based service.
- application server may communicate with network server 125 , application servers 140 - 160 , controller 190 , clients 105 , 115 and 192 , and data stores 180 - 185 .
- Application server 130 may also communicate with other machines and devices (not illustrated in FIG. 1 ).
- Application server 130 may host an application or portions of a distributed application and include a virtual machine 132 , agent 134 , and other software modules.
- Application server 130 may be implemented as one server or multiple servers as illustrated in FIG. 1 .
- Virtual machine 132 may be implemented by code running on one or more application servers. The code may implement computer programs, modules and data structures to implement a virtual machine mode for executing programs and applications. In some embodiments, more than one virtual machine 132 may execute on an application server 130 .
- a virtual machine may be implemented as a Java Virtual Machine (JVM). Virtual machine 132 may perform all or a portion of a business transaction performed by application servers comprising system 100 .
- a virtual machine may be considered one of several services that implement a web service.
- JVM Java Virtual Machine
- Virtual machine 132 may be instrumented using byte code insertion, or byte code instrumentation, to modify the object code of the virtual machine.
- the instrumented object code may include code used to detect calls received by virtual machine 132 , calls sent by virtual machine 132 , and communicate with agent 134 during execution of an application on virtual machine 132 .
- other code may be byte code instrumented, such as code comprising an application which executes within virtual machine 132 or an application which may be executed on application server 130 and outside virtual machine 132 .
- applications may execute on servers in program containers other than a virtual machine.
- applications may be executed in PHP on any of servers 130 - 160 .
- Agent 134 on application server 130 may be installed on application server 130 by instrumentation of object code, downloading the application to the server, or in some other manner. Agent 134 may be executed to monitor application server 130 , monitor virtual machine 132 , and communicate with byte instrumented code on application server 130 , virtual machine 132 or another application on application server 130 . Agent 134 may detect operations such as receiving calls and sending requests by application server 130 and virtual machine 132 . Agent 134 may receive data from instrumented code of the virtual machine 132 , process the data and transmit the data to controller 190 . Agent 134 may perform other operations related to monitoring virtual machine 132 and application server 130 as discussed herein. For example, agent 134 may identify other applications, share business transaction data, aggregate detected runtime data, and other operations.
- Each of application servers 140 , 150 and 160 may include an application and an agent. Each application may run on the corresponding application server or a virtual machine. Each of virtual machines 142 , 152 and 162 on application servers 140 - 160 may operate similarly to virtual machine 132 and host one or more applications which perform at least a portion of a distributed business transaction. Agents 144 , 154 and 164 may monitor the virtual machines 142 - 162 , collect and process data at runtime of the virtual machines, and communicate with controller 190 . The virtual machines 132 , 142 , 152 and 162 may communicate with each other as part of performing a distributed transaction. In particular each virtual machine may call any application or method of another virtual machine.
- Asynchronous network machine 170 may engage in asynchronous communications with one or more application servers, such as application server 150 and 160 .
- application server 150 may transmit several calls or messages to an asynchronous network machine.
- the asynchronous network machine may process the messages and eventually provide a response, such as a processed message, to application server 160 . Because there is no return message from the asynchronous network machine to application server 150 , the communications between them are asynchronous.
- Data stores 180 and 185 may each be accessed by application servers such as application server 150 .
- Data store 185 may also be accessed by application server 150 .
- Each of data stores 180 and 185 may store data, process data, and return queries received from an application server.
- Each of data stores 180 and 185 may or may not include an agent.
- Controller 190 may control and manage monitoring of business transactions distributed over application servers 130 - 160 .
- controller 190 may receive runtime data, including data associated with monitoring client requests at client 105 and mobile device 115 , from data collection server 160 .
- controller 190 may receive runtime data from each of agents 112 , 119 , 134 , 144 and 154 .
- Controller 190 may associate portions of business transaction data with other portions of business transaction data and virtual machines, applications, and other nodes and hardware that the business transaction data is generated from monitoring, communicate with agents to configure collection of runtime data, and provide performance data and reporting through an interface.
- Performance data may include metrics, errors, and other data and events which may be captured and/or generated during the monitoring of a distributed transaction.
- the interface may be viewed as a web-based interface viewable by client device 192 , which may be a mobile device, client device, or any other platform for viewing an interface provided by controller 190 .
- client device 192 may directly communicate with controller 190 to view an interface for monitoring data.
- Controller 190 may also correlate request metrics with business transaction data received from client 105 and mobile device 115 and from application servers 130 - 150 , respectively.
- Controller 190 may receive data from each of agents 134 - 154 , may detect nodes that are not performing as desired, and may initiate actions on one or more of the nodes.
- FIG. 2 is a block diagram of a controller. Controller 200 may be used to implement controller 190 of the block diagram of FIG. 1 . Controller 200 may include health rules 210 , actions 220 , and policy engine 220 . Health rules 210 may include one or more rules which specify an expression involving performance data. Performance data may include a metric, error, or other value or trend detected, calculated or generated from monitoring the system of FIG. 1 . The expression may relate to one or more business applications, a method, a cluster, a node, a resource, or some other entity.
- Controller 190 may install an agent into one or more virtual machines and/or application servers 130 . Controller 190 may receive correlation configuration data, such as an object, a method, or class identifier, from a user through client device 192 .
- Actions 220 may be applied to a resource (such as a node) per a decision by policy engine 220 .
- the actions may be performed by a machine agent or software agent.
- the actions may create additional instances of virtual machines, restart a machine, execute a string of commands via script code, and perform other operations. Additional examples of actions include configuring a new or restarted virtual machine, installing an agent in a virtual machine, applying a configuration to a virtual machine or application, restarting an application, and other actions.
- Policy engine 220 determines what action should be applied to an application or node based on the health rule violation detected.
- a policy engine 220 may detect that a health rule is violated by a first node and select a particular action to apply to a second node.
- Policy engine 220 may retrieve a list of health rule violations, the health rule violator, and corresponding action from a table of corresponding health rules and actions. In this case, health rules 210 and actions 220 may be stored and correlated together in a table at controller 200 .
- FIG. 3 is an exemplary flowchart for managing application performance.
- agents and a controller are initialized at step 310 .
- Initializing the agents and controller may include installing agents on nodes of a distributed system, installing agents in clients via embedding them in HTML code downloaded into web browser applications, instrumenting code and/or adding code in an application or other program by the agents, and other configurations to the agents and controller.
- Applications may be monitored at step 320 .
- the applications may be monitored by one or more agents located at or in communication with the applications or programs.
- the agents may collect data, aggregate the data, process data, perform processing, and send data to a controller.
- the agents may also send raw data without aggregating the data to controller 190 . More information for monitoring an application is disclosed in U.S. patent application Ser. No.
- Performance data including metrics and error identification, may be determined at step 330 .
- the performance data values may include response time, CPU usage, memory usage, error rates and other error information, and other values detected, generated or created from monitoring the system of FIG. 1 .
- the performance data values may include, for example, any measure of performance or usage by node software or hardware on which the node software executes, as well as a combination of software applications and hardware applications.
- the performance data values may be determined from data collected and aggregated by agents 112 , 119 , and 134 - 164 of the system of FIG. 1 and reported to controller 190 .
- Health rules may then be applied to the performance data for multiple nodes at step 340 .
- the health rules may be applied to node performance data by health rule module 210 of controller 200 . Applying the health rules to the performance data may determine if a performance data value, or trend of values, satisfies a threshold or other expression indicated in the health rule. A determination may then be made as to whether a first node being monitored does not satisfy a health rule at step 350 .
- a node such as a server, may not satisfy a particular health rule. For example, a first node may violate a CPU usage limit of 60% by using CPU usage at 70%.
- a corrective action may be applied to a second node based on the health rule violation for the first node at step 360 .
- the true source of a delay or failure at a first node may be present at a second node.
- a request by a first node that takes a long time to complete may be due to lack of resources at a second node which receives the request.
- the second node may be selected based on stored data in association with the first node and the particular failure or metric. Applying corrective action to a second node based on a detection at a first node is discussed in more detail below with respect to the method of FIG. 4 .
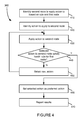
- FIG. 4 is an exemplary flowchart for applying corrective actions to a node.
- the method of FIG. 4 provides more detail for step 360 in the method of FIG. 3 .
- the selected node may process the same distributed transaction as the first node.
- the second node in some instances, may process a request sent from the first node to the second node or one or more intervening nodes between the first node and second node.
- the second nodes may be chosen randomly, at least in part on one or more parameters, as well as based on other techniques.
- the parameters may include a geo location of the device which violated the health rule, a history of the machine which violated the health rule, a date and time of the violation, a platform of the machine which violated the health rule, and other parameters.
- the second node is selected based on a rule and the type of metric for which the health rule was violated.
- An action is selected to apply to the selected application node at step 420 .
- the action may be selected by policy engine 220 .
- the policy engine may be configured to apply a particular action for a particular health rule violation. Different levels of violations may correspond to different actions.
- the selected action may be a first action from a list of several actions. The actions may be presorted based on the probability they have of succeeding.
- the selected action is applied to the selected application node at step 430 .
- the action may be implemented by script code, via an instruction to an agent, or in some other manner.
- the first node may be monitored to see if an improvement can be detected.
- the selected node performance need not completely satisfy the health node, but may still be reported if an improvement in performance is observed in view of the previous performance of the node.
- the selected action may set as the first action in a list of actions to be applied for future health rule violations of similar type at step 480 .
- the results are then reported to an administrator or otherwise, as configured by a user or administrator, at step 490 .
- FIG. 5 is a block diagram of a computer system for implementing the present technology.
- System 500 of FIG. 5 may be implemented in the contexts of the likes of clients 105 and 192 , network server 125 , application servers 130 - 160 , and data stores 190 - 185 .
- a system similar to that in FIG. 5 may be used to implement mobile device 115 , but may include additional components such as an antenna, additional microphones, and other components typically found in mobile devices such as a smart phone or tablet computer.
- the computing system 500 of FIG. 5 includes one or more processors 510 and memory 510 .
- Main memory 510 stores, in part, instructions and data for execution by processor 510 .
- Main memory 510 can store the executable code when in operation.
- the system 500 of FIG. 5 further includes a mass storage device 530 , portable storage medium drive(s) 540 , output devices 550 , user input devices 560 , a graphics display 570 , and peripheral devices 580 .
- processor unit 510 and main memory 510 may be connected via a local microprocessor bus, and the mass storage device 530 , peripheral device(s) 580 , portable storage device 540 , and display system 570 may be connected via one or more input/output (I/O) buses.
- I/O input/output
- Mass storage device 530 which may be implemented with a magnetic disk drive or an optical disk drive, is a non-volatile storage device for storing data and instructions for use by processor unit 510 . Mass storage device 530 can store the system software for implementing embodiments of the present invention for purposes of loading that software into main memory 510 .
- Portable storage device 540 operates in conjunction with a portable non-volatile storage medium, such as a floppy disk, compact disk or Digital video disc, to input and output data and code to and from the computer system 500 of FIG. 5 .
- the system software for implementing embodiments of the present invention may be stored on such a portable medium and input to the computer system 500 via the portable storage device 540 .
- Input devices 560 provide a portion of a user interface.
- Input devices 560 may include an alpha-numeric keypad, such as a keyboard, for inputting alpha-numeric and other information, or a pointing device, such as a mouse, a trackball, stylus, or cursor direction keys.
- the system 500 as shown in FIG. 5 includes output devices 550 . Examples of suitable output devices include speakers, printers, network interfaces, and monitors.
- Display system 570 may include a liquid crystal display (LCD) or other suitable display device.
- Display system 570 receives textual and graphical information, and processes the information for output to the display device.
- LCD liquid crystal display
- Peripherals 580 may include any type of computer support device to add additional functionality to the computer system.
- peripheral device(s) 580 may include a modem or a router.
- the components contained in the computer system 500 of FIG. 5 are those typically found in computer systems that may be suitable for use with embodiments of the present invention and are intended to represent a broad category of such computer components that are well known in the art.
- the computer system 500 of FIG. 5 can be a personal computer, hand held computing device, telephone, mobile computing device, workstation, server, minicomputer, mainframe computer, or any other computing device.
- the computer can also include different bus configurations, networked platforms, multi-processor platforms, etc.
- Various operating systems can be used including Unix, Linux, Windows, Macintosh OS, Palm OS, and other suitable operating systems.
- FIG. 6 is a block diagram of an exemplary mobile device for implementing the present technology.
- the system of FIG. 6 may be used to implement mobile device 115 .
- Mobile device 600 of FIG. 6 includes one or more processors 610 and memory 612 .
- Memory 612 stores, in part, programs, instructions and data for execution and processing by processor 610 .
- the system 600 of FIG. 6 further includes storage 614 , one or more antennas 616 , a display system 618 , inputs 620 , one or more microphones 622 , and one or more speakers 624 .
- processor unit 610 and main memory 612 may be connected via a local microprocessor bus
- storage 614 , display system 618 , input 620 , and microphone 622 and speaker 624 may be connected via one or more input/output (I/O) buses.
- Memory 612 may include local memory such as RAM and ROM, portable memory in the form of an insertable memory card or other attachment (e.g., via universal serial bus), a magnetic disk drive or an optical disk drive, a form of FLASH or PROM memory, or other electronic storage medium. Memory 612 can store the system software for implementing embodiments of the present invention for purposes of loading that software into main memory 610 .
- Antenna 616 may include one or more antennas for communicating wirelessly with another device.
- Antenna 616 may be used, for example, to communicate wirelessly via Wi-Fi, Bluetooth, with a cellular network, or with other wireless protocols and systems.
- the one or more antennas may be controlled by a processor 610 , which may include a controller, to transmit and receive wireless signals.
- processor 610 execute programs stored in memory 612 to control antenna 616 transmit a wireless signal to a cellular network and receive a wireless signal from a cellular network.
- Display system 618 may include a liquid crystal display (LCD), a touch screen display, or other suitable display device. Display system 618 may be controlled to display textual and graphical information and output to text and graphics through a display device. When implemented with a touch screen display, the display system may receive input and transmit the input to processor 610 and memory 612 .
- LCD liquid crystal display
- touch screen display or other suitable display device. Display system 618 may be controlled to display textual and graphical information and output to text and graphics through a display device. When implemented with a touch screen display, the display system may receive input and transmit the input to processor 610 and memory 612 .
- Input devices 620 provide a portion of a user interface.
- Input devices 620 may include an alpha-numeric keypad, such as a keyboard, for inputting alpha-numeric and other information, a touch-screen, microphone, camera, buttons or switches, a trackball, stylus, or cursor direction keys.
- Microphone 622 may include one or more microphone devices which transmit captured acoustic signals to processor 610 and memory 612 .
- the acoustic signals may be processed to transmit over a network via antenna 616 .
- Speaker 624 may provide an audio output for mobile device 600 .
- a signal received at antenna 616 may be processed by a program stored in memory 612 and executed by processor 610 .
- the output of the executed program may be provided to speaker 624 which provides audio.
- processor 610 may generate an audio signal, for example an audible alert, and output the audible alert through speaker 624 .
- the mobile device system 600 as shown in FIG. 6 may include devices and components in addition to those illustrated in FIG. 6 .
- mobile device system 600 may include an additional network interface such as a universal serial bus (USB) port.
- USB universal serial bus
- the components contained in the computer system 600 of FIG. 6 are those typically found in mobile device systems that may be suitable for use with embodiments of the present invention and are intended to represent a broad category of such mobile device components that are well known in the art.
- the computer system 600 of FIG. 6 can be a cellular phone, smart phone, hand held computing device, minicomputer, or any other computing device.
- the mobile device can also include different bus configurations, networked platforms, multi-processor platforms, etc.
- Various operating systems can be used including Unix, Linux, Windows, Macintosh OS, Google OS, Palm OS, and other suitable operating systems.
Abstract
Description
Claims (30)
Priority Applications (2)
| Application Number | Priority Date | Filing Date | Title |
|---|---|---|---|
| US14/175,945 US9658917B2 (en) | 2014-02-07 | 2014-02-07 | Server performance correction using remote server actions |
| US15/582,699 US10452469B2 (en) | 2014-02-07 | 2017-04-30 | Server performance correction using remote server actions |
Applications Claiming Priority (1)
| Application Number | Priority Date | Filing Date | Title |
|---|---|---|---|
| US14/175,945 US9658917B2 (en) | 2014-02-07 | 2014-02-07 | Server performance correction using remote server actions |
Related Child Applications (1)
| Application Number | Title | Priority Date | Filing Date |
|---|---|---|---|
| US15/582,699 Continuation US10452469B2 (en) | 2014-02-07 | 2017-04-30 | Server performance correction using remote server actions |
Publications (2)
| Publication Number | Publication Date |
|---|---|
| US20150227412A1 US20150227412A1 (en) | 2015-08-13 |
| US9658917B2 true US9658917B2 (en) | 2017-05-23 |
Family
ID=53775011
Family Applications (2)
| Application Number | Title | Priority Date | Filing Date |
|---|---|---|---|
| US14/175,945 Active US9658917B2 (en) | 2014-02-07 | 2014-02-07 | Server performance correction using remote server actions |
| US15/582,699 Active 2034-04-11 US10452469B2 (en) | 2014-02-07 | 2017-04-30 | Server performance correction using remote server actions |
Family Applications After (1)
| Application Number | Title | Priority Date | Filing Date |
|---|---|---|---|
| US15/582,699 Active 2034-04-11 US10452469B2 (en) | 2014-02-07 | 2017-04-30 | Server performance correction using remote server actions |
Country Status (1)
| Country | Link |
|---|---|
| US (2) | US9658917B2 (en) |
Families Citing this family (9)
| Publication number | Priority date | Publication date | Assignee | Title |
|---|---|---|---|---|
| US20160323397A1 (en) * | 2015-04-30 | 2016-11-03 | AppDynamics Inc. | Aysnchronous Custom Exit Points |
| US9838488B2 (en) * | 2015-04-30 | 2017-12-05 | Appdynamics Llc | Agent asynchronous transaction monitor |
| US9531614B1 (en) * | 2015-10-30 | 2016-12-27 | AppDynamics, Inc. | Network aware distributed business transaction anomaly detection |
| US10452511B2 (en) * | 2016-04-29 | 2019-10-22 | International Business Machines Corporation | Server health checking |
| US11627193B2 (en) * | 2017-12-07 | 2023-04-11 | Oracle International Corporation | Method and system for tracking application activity data from remote devices and generating a corrective action data structure for the remote devices |
| US11860758B2 (en) | 2018-05-07 | 2024-01-02 | Google Llc | System for adjusting application performance based on platform level benchmarking |
| US11693755B2 (en) | 2019-04-19 | 2023-07-04 | Microsoft Technology Licensing, Llc. | Optimizing hardware replacement using performance analytics |
| CN112200397B (en) * | 2019-07-08 | 2023-10-27 | 中国移动通信集团湖南有限公司 | Service monitoring and early warning implementation method |
| IT201900024544A1 (en) * | 2019-12-18 | 2021-06-18 | Blueit S P A Soc Benefit | Method of control of computer infrastructures |
Citations (15)
| Publication number | Priority date | Publication date | Assignee | Title |
|---|---|---|---|---|
| US6163853A (en) * | 1997-05-13 | 2000-12-19 | Micron Electronics, Inc. | Method for communicating a software-generated pulse waveform between two servers in a network |
| US6304905B1 (en) * | 1998-09-16 | 2001-10-16 | Cisco Technology, Inc. | Detecting an active network node using an invalid protocol option |
| US20020065922A1 (en) * | 2000-11-30 | 2002-05-30 | Vijnan Shastri | Method and apparatus for selection and redirection of an existing client-server connection to an alternate data server hosted on a data packet network (DPN) based on performance comparisons |
| US6757118B1 (en) * | 1999-03-26 | 2004-06-29 | Seagate Technology Llc | Apparatus and method for wiggle recovery in a disc drive having an embedded servo |
| US20060195561A1 (en) * | 2005-02-28 | 2006-08-31 | Microsoft Corporation | Discovering and monitoring server clusters |
| US20080062863A1 (en) * | 2006-09-12 | 2008-03-13 | Qualcomm Incorporated | Transaction timeout handling in communication session management |
| US20080222154A1 (en) * | 2007-03-08 | 2008-09-11 | Xerox Corporation | Decentralized Adaptive Management of Distributed Resource Replicas in a Peer-to-Peer Network Based on QoS |
| US20090300430A1 (en) * | 2008-06-02 | 2009-12-03 | Orit Nissan-Messing | History-based prioritizing of suspected components |
| US20100046546A1 (en) * | 2006-08-22 | 2010-02-25 | Maruthi Ram | Systems and methods for providing dynamic spillover of virtual servers based on bandwidth |
| US20120303670A1 (en) * | 2011-05-26 | 2012-11-29 | Gillen Robert E | Cloud computing method for dynamically scaling a process across physical machine boundaries |
| US20130111467A1 (en) * | 2011-10-27 | 2013-05-02 | Cisco Technology, Inc. | Dynamic Server Farms |
| US20140082417A1 (en) * | 2011-08-03 | 2014-03-20 | Honeywell International Inc. | Systems and methods for using a corrective action as diagnostic evidence |
| US8862947B1 (en) * | 2011-12-29 | 2014-10-14 | Google Inc. | Application version deployment using crash reports |
| US20150067147A1 (en) | 2013-09-04 | 2015-03-05 | AppDynamics, Inc. | Group server performance correction via actions to server subset |
| US20150134831A1 (en) * | 2013-11-13 | 2015-05-14 | Fujitsu Limited | Management method and apparatus |
-
2014
- 2014-02-07 US US14/175,945 patent/US9658917B2/en active Active
-
2017
- 2017-04-30 US US15/582,699 patent/US10452469B2/en active Active
Patent Citations (16)
| Publication number | Priority date | Publication date | Assignee | Title |
|---|---|---|---|---|
| US6163853A (en) * | 1997-05-13 | 2000-12-19 | Micron Electronics, Inc. | Method for communicating a software-generated pulse waveform between two servers in a network |
| US6304905B1 (en) * | 1998-09-16 | 2001-10-16 | Cisco Technology, Inc. | Detecting an active network node using an invalid protocol option |
| US6757118B1 (en) * | 1999-03-26 | 2004-06-29 | Seagate Technology Llc | Apparatus and method for wiggle recovery in a disc drive having an embedded servo |
| US20020065922A1 (en) * | 2000-11-30 | 2002-05-30 | Vijnan Shastri | Method and apparatus for selection and redirection of an existing client-server connection to an alternate data server hosted on a data packet network (DPN) based on performance comparisons |
| US20060195561A1 (en) * | 2005-02-28 | 2006-08-31 | Microsoft Corporation | Discovering and monitoring server clusters |
| US20100046546A1 (en) * | 2006-08-22 | 2010-02-25 | Maruthi Ram | Systems and methods for providing dynamic spillover of virtual servers based on bandwidth |
| US20080062863A1 (en) * | 2006-09-12 | 2008-03-13 | Qualcomm Incorporated | Transaction timeout handling in communication session management |
| US20080222154A1 (en) * | 2007-03-08 | 2008-09-11 | Xerox Corporation | Decentralized Adaptive Management of Distributed Resource Replicas in a Peer-to-Peer Network Based on QoS |
| US20090300430A1 (en) * | 2008-06-02 | 2009-12-03 | Orit Nissan-Messing | History-based prioritizing of suspected components |
| US20120303670A1 (en) * | 2011-05-26 | 2012-11-29 | Gillen Robert E | Cloud computing method for dynamically scaling a process across physical machine boundaries |
| US20140082417A1 (en) * | 2011-08-03 | 2014-03-20 | Honeywell International Inc. | Systems and methods for using a corrective action as diagnostic evidence |
| US20130111467A1 (en) * | 2011-10-27 | 2013-05-02 | Cisco Technology, Inc. | Dynamic Server Farms |
| US8862947B1 (en) * | 2011-12-29 | 2014-10-14 | Google Inc. | Application version deployment using crash reports |
| US20150067147A1 (en) | 2013-09-04 | 2015-03-05 | AppDynamics, Inc. | Group server performance correction via actions to server subset |
| GB2518052A (en) | 2013-09-04 | 2015-03-11 | Appdynamics Inc | Group server performance correction via actions to server subset |
| US20150134831A1 (en) * | 2013-11-13 | 2015-05-14 | Fujitsu Limited | Management method and apparatus |
Non-Patent Citations (1)
| Title |
|---|
| U.S. Appl. No. 14/018,355, filed Sep. 4, 2013, Ido Carmel, Group Server Performance Via Actions to Server Subset. |
Also Published As
| Publication number | Publication date |
|---|---|
| US20150227412A1 (en) | 2015-08-13 |
| US10452469B2 (en) | 2019-10-22 |
| US20180081751A1 (en) | 2018-03-22 |
Similar Documents
| Publication | Publication Date | Title |
|---|---|---|
| US9384114B2 (en) | Group server performance correction via actions to server subset | |
| US10452469B2 (en) | Server performance correction using remote server actions | |
| US10212063B2 (en) | Network aware distributed business transaction anomaly detection | |
| US9961129B2 (en) | Business transaction correlation with client request monitoring data | |
| US20170126789A1 (en) | Automatic Software Controller Configuration based on Application and Network Data | |
| US9990214B2 (en) | Dynamic agent delivery | |
| US20150067146A1 (en) | Custom correlation of a distributed business transaction | |
| US10216601B2 (en) | Agent dynamic service | |
| US10380867B2 (en) | Alert management within a network based virtual collaborative space | |
| US10084637B2 (en) | Automatic task tracking | |
| US10067862B2 (en) | Tracking asynchronous entry points for an application | |
| US10223407B2 (en) | Asynchronous processing time metrics | |
| US10025646B2 (en) | Naming of nodes in NET framework | |
| US10191844B2 (en) | Automatic garbage collection thrashing monitoring | |
| US10432490B2 (en) | Monitoring single content page application transitions | |
| US20150222505A1 (en) | Business transaction resource usage tracking | |
| US9942361B2 (en) | Reporting page composition data | |
| US9935856B2 (en) | System and method for determining end user timing |
Legal Events
| Date | Code | Title | Description |
|---|---|---|---|
| AS | Assignment |
Owner name: APPDYNAMICS, INC, CALIFORNIA Free format text: ASSIGNMENT OF ASSIGNORS INTEREST;ASSIGNOR:SAWANT, ABHIJIT;REEL/FRAME:038372/0206 Effective date: 20160424 Owner name: APPDYNAMICS, INC, CALIFORNIA Free format text: ASSIGNMENT OF ASSIGNORS INTEREST;ASSIGNORS:CARMEL, IDO;SINGH, RAGHVENDRA;MORGAN, ANDREW;AND OTHERS;SIGNING DATES FROM 20150520 TO 20150526;REEL/FRAME:038372/0301 |
|
| STCF | Information on status: patent grant |
Free format text: PATENTED CASE |
|
| AS | Assignment |
Owner name: APPDYNAMICS LLC, DELAWARE Free format text: CHANGE OF NAME;ASSIGNOR:APPDYNAMICS, INC.;REEL/FRAME:042964/0229 Effective date: 20170616 |
|
| AS | Assignment |
Owner name: CISCO TECHNOLOGY, INC., CALIFORNIA Free format text: ASSIGNMENT OF ASSIGNORS INTEREST;ASSIGNOR:APPDYNAMICS LLC;REEL/FRAME:044173/0050 Effective date: 20171005 |
|
| MAFP | Maintenance fee payment |
Free format text: PAYMENT OF MAINTENANCE FEE, 4TH YEAR, LARGE ENTITY (ORIGINAL EVENT CODE: M1551); ENTITY STATUS OF PATENT OWNER: LARGE ENTITY Year of fee payment: 4 |