US8706537B1 - Remote clinical study site monitoring and data quality scoring - Google Patents
Remote clinical study site monitoring and data quality scoring Download PDFInfo
- Publication number
- US8706537B1 US8706537B1 US13/679,533 US201213679533A US8706537B1 US 8706537 B1 US8706537 B1 US 8706537B1 US 201213679533 A US201213679533 A US 201213679533A US 8706537 B1 US8706537 B1 US 8706537B1
- Authority
- US
- United States
- Prior art keywords
- site
- data
- metric
- risk
- clinical
- Prior art date
- Legal status (The legal status is an assumption and is not a legal conclusion. Google has not performed a legal analysis and makes no representation as to the accuracy of the status listed.)
- Active
Links
Images


Classifications
-
- G—PHYSICS
- G06—COMPUTING; CALCULATING OR COUNTING
- G06Q—INFORMATION AND COMMUNICATION TECHNOLOGY [ICT] SPECIALLY ADAPTED FOR ADMINISTRATIVE, COMMERCIAL, FINANCIAL, MANAGERIAL OR SUPERVISORY PURPOSES; SYSTEMS OR METHODS SPECIALLY ADAPTED FOR ADMINISTRATIVE, COMMERCIAL, FINANCIAL, MANAGERIAL OR SUPERVISORY PURPOSES, NOT OTHERWISE PROVIDED FOR
- G06Q10/00—Administration; Management
- G06Q10/10—Office automation; Time management
-
- G—PHYSICS
- G16—INFORMATION AND COMMUNICATION TECHNOLOGY [ICT] SPECIALLY ADAPTED FOR SPECIFIC APPLICATION FIELDS
- G16H—HEALTHCARE INFORMATICS, i.e. INFORMATION AND COMMUNICATION TECHNOLOGY [ICT] SPECIALLY ADAPTED FOR THE HANDLING OR PROCESSING OF MEDICAL OR HEALTHCARE DATA
- G16H50/00—ICT specially adapted for medical diagnosis, medical simulation or medical data mining; ICT specially adapted for detecting, monitoring or modelling epidemics or pandemics
- G16H50/30—ICT specially adapted for medical diagnosis, medical simulation or medical data mining; ICT specially adapted for detecting, monitoring or modelling epidemics or pandemics for calculating health indices; for individual health risk assessment
-
- G—PHYSICS
- G16—INFORMATION AND COMMUNICATION TECHNOLOGY [ICT] SPECIALLY ADAPTED FOR SPECIFIC APPLICATION FIELDS
- G16H—HEALTHCARE INFORMATICS, i.e. INFORMATION AND COMMUNICATION TECHNOLOGY [ICT] SPECIALLY ADAPTED FOR THE HANDLING OR PROCESSING OF MEDICAL OR HEALTHCARE DATA
- G16H70/00—ICT specially adapted for the handling or processing of medical references
- G16H70/40—ICT specially adapted for the handling or processing of medical references relating to drugs, e.g. their side effects or intended usage
-
- G—PHYSICS
- G16—INFORMATION AND COMMUNICATION TECHNOLOGY [ICT] SPECIALLY ADAPTED FOR SPECIFIC APPLICATION FIELDS
- G16H—HEALTHCARE INFORMATICS, i.e. INFORMATION AND COMMUNICATION TECHNOLOGY [ICT] SPECIALLY ADAPTED FOR THE HANDLING OR PROCESSING OF MEDICAL OR HEALTHCARE DATA
- G16H40/00—ICT specially adapted for the management or administration of healthcare resources or facilities; ICT specially adapted for the management or operation of medical equipment or devices
- G16H40/60—ICT specially adapted for the management or administration of healthcare resources or facilities; ICT specially adapted for the management or operation of medical equipment or devices for the operation of medical equipment or devices
- G16H40/67—ICT specially adapted for the management or administration of healthcare resources or facilities; ICT specially adapted for the management or operation of medical equipment or devices for the operation of medical equipment or devices for remote operation
-
- G—PHYSICS
- G16—INFORMATION AND COMMUNICATION TECHNOLOGY [ICT] SPECIALLY ADAPTED FOR SPECIFIC APPLICATION FIELDS
- G16H—HEALTHCARE INFORMATICS, i.e. INFORMATION AND COMMUNICATION TECHNOLOGY [ICT] SPECIALLY ADAPTED FOR THE HANDLING OR PROCESSING OF MEDICAL OR HEALTHCARE DATA
- G16H80/00—ICT specially adapted for facilitating communication between medical practitioners or patients, e.g. for collaborative diagnosis, therapy or health monitoring
Definitions
- Distributed systems exist that consist of a number of similar sites geographically distributed that perform similar types of tasks. Examples of these systems are franchise systems, sales offices of a company, and clinical drug trials. It may be desirable to monitor data generated at these sites to ensure uniformity of operation and integrity of the data. Such quality monitoring may be performed on site or remotely.
- testing process which includes clinical trials, clinical data concerning the safety, efficacy, as well as other critical attributes of the tested drug or device are typically collected for submission to the United States Food and Drug Administration (FDA) or other regulatory agency.
- FDA United States Food and Drug Administration
- tens of thousands of clinical trials are run annually, involving millions of volunteers. These volunteers are generally tested at a variety of locations, known as clinical sites, and each site generates data regarding the drug or device under investigation as well as data regarding the testing process itself.
- on-site monitoring of clinical trials which usually entails traveling to each site numerous times, can use over 30% of a drug company's clinical trial budget, on-site monitoring represents one of the largest cost drivers in clinical research.
- FIG. 1 is a block diagram of a system including a risk assessment apparatus according to an embodiment of the present invention
- FIGS. 2A-2D are block diagrams showing operation of the risk assessment apparatus illustrated in FIG. 1 ;
- FIGS. 3A-3C are illustrations of metric risk profiles according to embodiments of the present invention.
- FIGS. 4A-4C are flowcharts illustrating the general operation of a risk assessment apparatus according to an embodiment of the present invention.
- FIG. 5 is an illustration of a graphical interface for displaying site-level data according to an embodiment of the present invention.
- FIG. 6 is an illustration of a graphical interface for displaying another view of site-level data according to an embodiment of the present invention.
- FIG. 7 is an illustration of a graphical interface for displaying country-level data according to an embodiment of the present invention.
- FIG. 8 is an illustration of a graphical interface for displaying overall study data according to an embodiment of the present invention.
- Embodiments of the present invention may be used in a variety of applications.
- the systems and methods disclosed herein may be used in or with clinical drug or device trials, monitoring of sales operations and associates, monitoring of retail services and locations, and other data-intensive applications in which users may desire to assess quickly the quality of data coming from a variety of sources.
- the present invention could be utilized in sales, retail, or franchise organizations, wherein the quality of data generated by remote offices or individuals in compliance or conjunction with a centralized office or rules could be monitored or assessed.
- a clinical trial (also called a clinical study, an interventional study, or, as used herein, a study or a trial) is typically directed to a specific therapeutic area, and may be categorized by phase.
- the drug or device may be tested on approximately 20 to 100 volunteers (also known as patients or subjects) in order to gather clinical data on safety and dosage; in Phase II, clinical data may be gathered from approximately 100 to 500 volunteers in order to gather clinical data on efficacy and side-effects; and in Phase III, clinical data may be gathered from approximately 500 to 3000 or more volunteers in order to collect definitive evidence of safety and efficacy to obtain marketing approval of the drug or device.
- a pharmaceutical company, an academic research center, a federal agency, or a clinical research center typically sponsors clinical trials.
- the Sponsor or its Contract Research Organization (CRO) (a person or an organization—commercial, academic, or other—contracted by the sponsor to perform one or more of a sponsor's trial-related duties and functions) generally selects the locations, known as Investigative Sites (“Sites”), at which the clinical study will be conducted. Sites typically can be hospitals, clinics, universities, doctors' offices, research institutions, or corporate trial locations. Over the course of a clinical study, the Principal Investigator (“PI”) or other personnel at the Site are typically responsible for recording data, including information about the subjects and clinical data.
- CRO Contract Research Organization
- CRFs case report forms
- eCRFs electronic CRFs
- EDC electronic data capture
- clinical data collected for the purpose of the clinical trial is typically first recorded into a site-specific source such as a paper-based patient chart or electronic medical record system prior to being transcribed into the EDC system being utilized for the clinical trial.
- site-specific source such as a paper-based patient chart or electronic medical record system
- Such manual transcription may lead to accidental data errors.
- a Site may be fraudulently entering incorrect clinical data or otherwise deviating from good clinical practice or from the study protocol.
- CRAs Site Monitors
- CRAs typically conduct periodic monitoring visits in order to make sure that data have been entered correctly, that all relevant source data have been transcribed into the EDC system, and that data are supported by source data in a patient's chart.
- monitoring visits may involve several steps and processes.
- the CRA typically meets with the PI and study coordinator, reviews informed consent forms, conducts Source Data Verification (SDV), reviews CRFs/eCRFs, raises monitoring queries, reviews safety data (Adverse Events and Severe Adverse Events), collects CRFs (if the CRF is in paper form), identifies and documents protocol deviations and violations, reviews the site file, reviews drug supply and drug handling, reviews screening logs, and visits all departments involved with the study.
- SDV Source Data Verification
- CRFs/eCRFs raises monitoring queries
- reviews safety data Adverse Events and Severe Adverse Events
- CRFs if the CRF is in paper form
- identifies and documents protocol deviations and violations reviews the site file, reviews drug
- the CRA may document the visit in a trip report, which is similar to an audit report. This report may then undergo a review and approval process with the CRA's manager. If the CRA works for a CRO, that CRO may consolidate completed visit reports on a periodic basis and submit them to the Sponsor.
- Source Data Verification can be the most resource-intensive and costly.
- CRA verification of all CRF/eCRF data known as 100% SDV, has been the industry norm, even though it is not required by current regulations.
- Current FDA Draft Guidance states that monitoring should include a mix of centralized monitoring (e.g., through the use of data checks, described below) and on-site monitoring. This mixed approach may reduce monitoring-related time and cost without compromising clinical data quality.
- EDC systems such as Medidata Solutions' Rave®
- TSDV Targeted Source Data Verification
- different blocks of clinical subjects may be assigned to different TSDV plans, whereby a first block of subjects could have all source data verified, but a second block of subjects would have less than 100% of their source data verified.
- the second block of subjects may require only the source data for certain data collection forms or fields verified, at the request of the administrator or planner of a clinical trial.
- Such systems may reduce monitoring requirements, but lack capabilities such as remote, centralized monitoring, which would further reduce the need for expensive on-site monitoring.
- This TSDV plan is static and would therefore remain in effect throughout the entirety of a study—in other words, the degree of SDV that every patient will undergo would be determined before a study begins.
- emerging data from the study could be used to modify the degree of SDV to be performed on future patients. This determination would be based on measures of risk that are emerging for each site.
- the inventors have realized that remote and central monitoring of one or more site-derived quality metrics can ensure high quality across all Sites in a clinical trial without incurring the traditionally high resource cost associated with 100% SDV.
- a Site or Sites with a higher likelihood (i.e., risk) of having quality issues in the conduct of the clinical trial can be identified proactively and the deficiency or deficiencies remediated.
- These deficiencies can be partially addressed through TSDV changes, as well as through less resource-intensive means than SDV, such as phone calls to sites to review and correct the deficient aspect of their trial conduct, etc.
- embodiments of the invention include development of metrics concerning clinical trial conduct at the site level, and these metrics may be grouped, normalized, or aggregated in order to determine an associated risk level and to utilize such risk levels to determine associated site-level quality scores, in order to more quickly identify trends in the data and to identify areas, personnel, and/or organizations that may require more in-depth review.
- Other embodiments may aggregate site-level data geographically, such as at a city level, state level, regional level, country level, or worldwide study level (i.e., across all sites within a given study), or organizationally, such as by CRA or other grouping having a common element, in order to allow a Sponsor or CRO to quickly identify appropriate internal resources to address any identified quality issues.
- An objective of these embodiments is to determine when a given site has deviated from a determined or expected range for a given quality metric by a degree that may indicate a significant quality issue. Another objective is to allow a user to measure and score the accuracy and trustworthiness of clinical trials performed at one or more clinical trial sites. Yet another objective is to provide a system of remote site data quality monitoring whereby a user of such system may be apprised of potential site data quality issues over varying periods of time, including near real-time.
- FIG. 1 is a block diagram of a system 100 including a risk assessment apparatus 10 , according to an embodiment of the present invention.
- System 100 may include a number of sites generating data and transferring such data over connections 15 , 25 to network 20 and to risk assessment apparatus 10 over connection 35 .
- Sites 112 , 114 , 116 and 122 , 124 , 126 may be located in various countries 110 , 120 or other geographically distinct areas (or other groupings of sites having a common element). While three sites and two countries are illustrated in FIG. 1 , the present invention contemplates the use of any number of sites in any number of countries.
- Network 20 may be any type of communications network, including a public or private telephone (e.g., cellular, public switched, etc.) network and/or a computer network, such as a LAN (local area network), a WAN (wide area network), or the Internet or an intranet, that facilitates risk assessment apparatus 10 to interact with the sites in order to send and receive data and other information.
- Connections 15 , 25 , and/or 35 may be wired or wireless connections or even a file transfer system, such as a CD, DVD, or thumb or flash drive, which contains data from the sites.
- the data may be associated with a clinical trial for a drug or medical device, or may be any other type of data that can assess operation at a site, including but not limited to performance of sales associates at different locations or performance of retail locations, including franchises.
- risk assessment apparatus 10 may calculate one or more quality scores 80 and risk indicators 90 based on study data 60 , received from the various sites, and historic or industry or other data 70 received from any source of data. Quality scores 80 and risk indicators 90 may then be used to evaluate each site, groupings of sites, or a study as a whole.
- Risk assessment apparatus 10 may be embodied on any type of computing program or application residing on any type of computing device, including but not limited to a personal, laptop, tablet, or mainframe computer, a mobile phone, or a personal digital assistant (PDA).
- PDA personal digital assistant
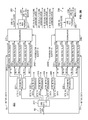
- FIGS. 2A-2D are block diagrams illustrating the operation of risk assessment apparatus 10 in more detail.
- FIG. 2A illustrates the main system blocks of risk assessment apparatus 10 , according to an embodiment of the present invention
- FIG. 2B shows how site-level quality scores and risk indicators may be determined, according to an embodiment of the present invention
- FIGS. 2C and 2D show how quality scores and risk indicators above the site level may be determined, according to an embodiment of the present invention.
- FIG. 2A shows site-level analysis block 201 and multiple-site analysis block 202 .
- Site-level analysis block 201 may take study data 60 and historic data 70 and may determine site-level quality scores, site-metric risk indicators, and site quality risk indicators.
- Site-level analysis block 201 is partially schematically illustrated in FIG. 2B .
- Multiple-site analysis block 202 may take site-metric risk indicators from site-level analysis block 201 and may determine multiple-site quality scores and multiple-site risk indicators.
- Multiple-site analysis block 202 is partially schematically illustrated in FIGS. 2C and 2D .
- site-level analysis block 201 may include site data filter 210 , site metric processors 221 - 226 , metric risk profilers 231 - 235 , aggregators 241 - 246 , and site risk profilers 251 - 256 . (For ease of readability of FIG. 2A , aggregators 242 - 245 and site risk profilers 252 - 255 are not shown.)
- Site data filter 210 may take study data 60 and separate out data from each individual site, for example, into site 112 data, site 114 data, site 116 data, etc. Alternatively, site data filter 210 may not be included in site-level analysis block 201 if individual site data are separately communicated to risk assessment apparatus 10 , for example, either directly from the sites themselves or via other transfer means such as CD, DVD, or thumb or flash drive.
- Site metric processors 221 - 226 may take the individual site data and separate out the data to determine the values of each of one or more metrics for an individual site.
- Five metrics, Metric1 (M1), Metric2 (M2), etc., are shown in FIG. 2B . These metrics could be for any of a number of measures for which data is collected at the sites. In the case of a clinical trial, the metrics could include query rate, subject visit to entry cycle time, query response cycle time, screen failure rate, early termination rate, adverse event (AE) rate, severe adverse event (SAE) rate, protocol deviation rate, and/or visit schedule deviation rate, as well as other metrics which may be appreciated by a person of ordinary skill in the art. Although five metrics are shown in FIG. 2B , any number of metrics may be determined from the data and used in risk assessment apparatus 10 .
- site metric processors 221 - 226 may not be included in site-level analysis block 201 if individual site metric data or site metrics are separately communicated to risk assessment apparatus 10 , for example, either directly from the sites themselves or via other transfer means such as CD, DVD, or thumb or flash drive.
- Each site collects clinical data associated with the metrics listed above, for example blood pressure data, heart rate data, and metabolism data, as well as monitoring data, such as meta-data associated with the collection of clinical data or other data concerning the gathering or processing of clinical data. All of this data from all of the sites comprises study data 60 and are communicated to risk assessment apparatus 10 .
- Site data filter 210 separates out the data for each site, for example, site 112 data, which may include the clinical data for site 112 as well as the monitoring data for that site.
- Site metric processor 221 takes the site 112 data, identifies the monitoring data, and separates out the data that will correspond to each metric M1-M5, such as the number of queries, the times for subject visit to entry cycle, the query response cycle times, the number of screen failures, and the number of early terminations. Site metric processor 221 then calculates values of metrics M1-M5, e.g., query rate, mean subject visit to entry cycle time, mean query response cycle time, screen failure rate, and early termination rate, using the separated site data.
- the values of metrics M1-M5 for site 112 denoted by M1 112 , M2 112 , etc., may be single numbers or other values that are then available to metric risk profilers 231 - 235 .
- Each metric risk profiler 231 - 235 receives a value associated with metrics M1-M5 and, using a metric risk profile which is typically specific to each metric risk profiler 231 - 235 , may calculate or normalize or categorize the metric into a site-metric risk indicator, e.g., R1-R30 (metric risk indicators R6-R25 are not shown in FIG. 2B ). It is also possible that the same metric risk profile is applied to more than one metric risk profiler. Typically, there will be a specific quantity of predetermined site-metric risk indicator designations. In one embodiment, there may be three site-metric risk indicator designations, e.g., low (L), medium (M), and high (H).
- L low
- M medium
- H high
- the embodiment also includes visual indicators of risk, low, medium, and high indicators may be indicated by colors, for example by green, yellow, and red, respectively.
- the values of metrics M1 through M5 for each site may be converted to an L, M, or H based on the metric risk profiles specific to each of the metric risk profilers 231 - 235 .
- the metric risk profiles may incorporate overall study data 60 and/or historic data 70 , as will now be explained in more detail.
- FIGS. 3A-3C are illustrations of metric risk profiles according to embodiments of the present invention. Specifically, the figures illustrate how historic and study data may be used to generate a metric risk profile for a metric. As described further below, each of the metrics discussed above (query rate, subject visit to entry cycle time, etc.) is typically associated with a specific metric risk profile.
- Historic or industry data 70 may come from studies performed in similar therapeutic areas or with similar numbers or types of sites or from similar clinical trial phases, or a combination of such factors.
- FIG. 3A shows a statistically normal distribution 310 of historic data indicating the mean 311 and the 2nd, 5th, 95th, and 98th percentiles 313 - 316 . These percentiles may be viewed as one or more brackets or ranges of values, each of which contains values that are outliers to a mean or average of historic data distribution 310 . For example, values for a particular metric historically falling between the 5th and 95th percentiles on distribution 310 may be viewed as being contained in a “low-risk” region of distribution 310 . It may also be determined that values for the metric that historically fell outside the 2nd and 98th percentiles indicated a problem that should have been addressed, in which case this region could be called the “high-risk” region. A “medium-risk” region would then have been between the low-risk and high-risk regions.
- historic 2nd, 5th, 95th, and 98th percentiles 313 - 316 may correspond to data with values 2, 3, 17, and 18. From the collection of study data, it may be determined that the study mean 321 is 20, i.e., twice the value of historic mean 311 . This ratio may then be used to modify the historic distribution 310 to generate modified benchmark distribution 320 . Risk-indicator threshold values (the points bounding the risk regions) for the study would be calculated using the same ratio, 2 in this example, of the study mean to the historic mean.
- values in the historic data distribution 310 corresponding to risk-indicator thresholds 323 - 326 for modified benchmark distribution 320 would be increased by the factor of 2 to 4, 6, 34, and 36, respectively.
- values 4 and 36 would be the high-risk-indicator thresholds 323 and 326 (indicated by “H”), and values 6 and 34 would be the medium-risk-indicator thresholds 324 and 325 (indicated by “M”).
- Values between risk-indicator thresholds 324 and 325 would correspond to a low-risk region on the modified benchmark distribution 320 .
- FIG. 3B shows another view of modified benchmark distribution 320 as a double-sided metric risk profile 302 .
- the value of study mean 321 is 20, and values 4 and 36 correspond to high-risk-indicator thresholds 323 and 326 , and values 6 and 34 correspond to medium-risk-indicator thresholds 324 and 325 .
- Low-risk region 330 lies between risk-indicator thresholds 324 and 325 ;
- medium-risk regions 340 a and 340 b lie between risk-indicator thresholds 323 , 324 and 325 , 326 , respectively, and high-risk regions 350 a and 350 b lie outside of risk-indicator thresholds 323 and 326 , respectively.
- Some metrics may use single-sided metric risk profiles, e.g., having a minimum and only one or more risk-indicator thresholds outside that minimum.
- the single-sided metric risk profile may be considered a special case of the double-sided metric risk profile.
- FIG. 3C shows single-sided metric risk profile 301 which may have 0 as a minimum.
- a low-risk region 360 may lie below, for example, the value 45 of the metric
- a medium-risk region 370 may lie between values of 45 and 63
- a high-risk region 380 may have a value of greater than 63.
- the risk-indicator thresholds corresponding to the values 45 and 63 may be determined by modifying specific historic-distribution percentiles, as was shown in FIG. 3A .
- the metric risk profiles shown in FIGS. 3A-3C comprise a benchmark and risk regions that can be determined in relation to deviations from the benchmark.
- a region of no risk may be considered a “risk region.”
- the benchmark may be a historic mean or median, an industry mean or median, a study mean or median, or combinations of these.
- the benchmark could also be a minimum (such as 0) or a maximum.
- Deviations from the benchmark may be determined based upon percentiles (e.g., 2nd, 5th, 95th, 98th) within a statistical distribution, standard deviations, portions of standard deviations (e.g., one-half of a standard deviation, 3.5 standard deviations), percent deviations from the benchmark (e.g., 5% and 10% deviation), fractions of a range, or other values of statistical significance.
- percentiles e.g., 2nd, 5th, 95th, 98th
- portions of standard deviations e.g., one-half of a standard deviation, 3.5 standard deviations
- percent deviations from the benchmark e.g., 5% and 10% deviation
- fractions of a range e.g., or other values of statistical significance.
- the risk-indicator thresholds do not need to be symmetric around the benchmark nor be part of a statistically normal distribution.
- FIGS. 3A-3C show three risk indicator regions, but there could be more or fewer risk indicator designations depending on the granularity desired by the user (e.g., the sponsor or CRO) or the risk assessment apparatus designer.
- a system or method employing two risk indicator designations will be appreciated as accomplishing the advantages of the present invention, as will a system or method employing a very large number of risk indicator designations.
- the site-metric risk indicators can be determined.
- the value 345 for the metric for the site is 5.5. Since this value falls within medium-risk region 340 a , the corresponding site-metric risk indicator for that metric at that site is determined to be “medium,” or other designation, and this site-metric risk indicator can then be utilized in generating a site-level quality score, e.g., 281 .
- the value 365 for the metric for the site is 30.
- the risk indicator for that metric at that site may be considered to be “low,” or other designation, and this site-metric risk indicator can likewise be used to generate the site-level quality score.
- embodiments of the present invention can determine the risk indicator for groups of sites, such as, for example, a city, region, state, country, continent, or study as a whole, or other groupings of sites not related to geography.
- an aggregator such as aggregator 241 aggregates site-metric risk indicators R1-R5 into a site-level quality score 281 using an aggregation algorithm such as aggregation algorithm 2401 . It is desirable that all the site-metric risk indicators that are aggregated to calculate a site-level quality score be determined using the same number of risk regions, e.g., R1-R5 all have L, M, or H designations, so that the aggregation may be performed using comparable metrics.
- One aggregation algorithm could be:
- Site-level quality score 100 * ( L + 0.5 ⁇ M L + M + H ) ( 1 )
- L, M, and H are the quantity of metric values, corresponding to one site of a study, having low, medium, or high designations, respectively.
- site-level quality score 281 may range from 0 to 100.
- Equation 1 may be generalized to yield equation 2:
- Site-level quality score K * ( aL + bM + cH L + M + H ) ( 3 ) where a, b, and c are coefficients that weight the effects of the three different risk designations and the value K determines the range of the score.
- site-level risk indicator 291 may then be determined using site risk profiler 251 .
- Site risk profiler 251 may operate analogously to metric risk profilers 231 - 235 described above by operation on site-level quality scores rather than site-level metric values, with or without the use of historic data.
- One site risk profile that may be used is a single-sided profile in which low risk is indicated for a site-level quality score of 95 or above (i.e., between 95 and 100), medium risk is indicated for a site-level quality score of 85 to 95, and high risk is indicated for a site-level quality score below 85 (i.e., between 0 and 85).
- the risk-indicator thresholds need not be 85 and 95, but may be any numbers within the range of the site-level quality score (e.g., between 0 and 100 or, more generally, between the minimum and the maximum “K” in Equation (3)).
- the choices of quantity of risk designations and risk-indicator thresholds may depend on the desired granularity of the risk analysis, and on the tolerance for possible risk.
- the site risk profiles may be modified based on actual study data, such that risk-indicator thresholds may change to convey the needed information regarding the actual site and/or study risk.
- Table 1 provides examples of possible values of site-level quality scores (SLQS) and site-level risk indicators (SLRI) for a group of five metrics Metric1 through Metric5 and a site risk profile having risk-indicator thresholds of 85 and 95.
- the site-level quality scores are calculated using Equation 1. Note that in some cases, there may not be enough data for specific measures to determine a metric value or site-metric risk indicator. This results in fewer than five metric values being used to calculate the site-level quality score.
- FIG. 2B shows similar details for generating site-level quality score 286 and site-level risk indicator 296 for site 126 .
- site 126 data may be separated out from study data 60 using site data filter 210 , and then site metric processor 226 may separate out the data for Metric1 through Metric5 for site 126 and then calculate M1 126 , M2 126 , etc., which are the values for Metric1 through Metric5 for site 126 .
- the metric values are then available to metric risk profilers 231 - 235 to normalize the metrics into a site-metric risk indicator (e.g., low, medium, or high) R26-R30.
- Aggregator 246 then aggregates the site 126 metric risk indicators R26-R30 into site-level quality score 286 using aggregation algorithm 2406 , which may be the same as or different from aggregation algorithm 2401 .
- site-level quality score 286 is determined, site-level risk indicator 296 may be determined using site risk profiler 256 , which may be the same as or different from site risk profiler 251 .
- Site-level quality scores and site-level risk indicators for the other sites 114 , 116 , 122 , 124 can be determined in the same way as that shown for sites 112 and 126 (not shown in detail in FIG. 2B ).
- FIG. 2C shows how quality scores and risk indicators may be determined across multiple sites for a given specific metric.
- the values of the metric, in this example Metric1 (M1), M1 112 , M1 114 , etc., from the sites are input to metric risk profiler 231 .
- Site-level metric risk indicators R1, R6, R11, R16, R21, R26 (e.g., low, medium, high) may be determined based upon the each site's Metric1 value, e.g., M1 112 , M1 114 , M1 116 , . . . , M1 126 .
- the resulting site-metric risk indicators are then aggregated in aggregator 248 using aggregation algorithm 2408 .
- Aggregation algorithm 2408 may be the same as or different from aggregation algorithms 2401 - 2406 .
- Aggregator 248 then generates quality score 288 for the multiple sites (i.e., for the group of six sites) for Metric1.
- a risk indicator 298 for the multiple sites for Metric1 may then be determined using risk profiler 258 , which may have a risk profile similar to or different from site risk profilers 251 - 256 .
- FIG. 2D shows how overall quality scores 289 and overall risk levels 299 may be determined for multiple sites AND for multiple metrics, for example, in order to determine such values at a country level or study level.
- the metric values M1 112 to M1 126 , M2 112 to M2 126 , etc., from each of the sites being aggregated are made available to their respective metric risk profilers.
- the values for Metric1 from each of the sites are input to metric risk profiler 231
- the Metric2 values from the sites are input to metric risk profiler 232 , etc. for the Metric3, Metric4, and Metric5 values.
- thirty site-metric risk indicators R1-R30 may be generated (unless there is insufficient data for a specific metric at a site).
- the thirty risk indicators may then be aggregated in aggregator 249 using aggregation algorithm 2409 , which may be the same as or different from aggregation algorithms 2401 - 2406 and 2408 .
- Aggregator 249 then generates an overall quality score 289 for the corresponding multiple sites and multiple metrics.
- An overall risk level 299 for the multiple sites and multiple metrics may then be determined using risk profiler 259 , which may have a risk profile similar to or different from site risk profilers 251 - 256 and 258 .
- Table 2 shows eighty-five site-metric risk indicators in total (17*5). (There may be fewer than eighty-five site-metric risk indicators if there were insufficient data for some metrics at some sites.) Each of the metrics can have a score calculated according to FIG. 2C , but all eighty five site-metric risk indicators are aggregated to calculate the overall quality score of 92.94 for the country. Where the overall quality score is between 85 and 95, the overall risk indicator for that country will be medium.
- a study-level score and risk indicator can be generated in much the same way, where all of the metric values for all of the sites are used.
- a different aggregation could be performed. Taking the country-level example above, with seventeen sites each having five metrics, instead of aggregating the eighty-five site-metric risk indicators, the five metric risk indicators across the seventeen sites could be aggregated, where each metric risk indicator is generated according to FIG. 2C .
- risk indicators could be generated for each site for all five metrics, such as is done to generate site-level risk indicators 291 - 296 in FIG. 2B , and then those risk indicators could be aggregated across the seventeen sites to generate an overall quality score and/or risk indicator.
- FIGS. 1 and 2 A- 2 D are examples of parts that may comprise system 100 and risk assessment apparatus 10 , and do not limit the parts or modules that may be included in or connected to or associated with system 100 and risk assessment apparatus 10 .
- site data filter 210 and site metric processors 221 - 226 may not be used if the specific data outputs of those blocks are available to risk assessment apparatus 10 in another manner, such as being directly communicated from the sites or directly presented to risk assessment apparatus 10 via a medium such as a CD, DVD, or thumb or flash drive.
- site data filter 210 and site metric processors 221 - 226 may reside in different physical “boxes” or devices, and the connections between them may be wired or wireless, via physically close connections or over a network, in a manner similar to connection 35 .
- metric risk profilers 231 - 235 are shown as separate blocks, they may be part of the same hardware or software routine but just have different input variables that determine the metric risk profiles themselves.
- site metric processors 221 - 226 are shown as separate blocks, they may be part of the same hardware or software routine but just have different processing rules that determine how to process the incoming site data to determine the requisite metric values.
- FIGS. 4A-4C are flowcharts illustrating the general operation of a system that includes risk assessment apparatus 10 according to an embodiment of the present invention.
- data may be generated at the various sites (operation 405 ).
- the data may be entered into an electronic data capture (EDC) program at the various sites.
- EDC electronic data capture
- the data may be transmitted from the sites to a remote or central monitoring apparatus, such as risk assessment apparatus 10 .
- risk assessment apparatus 10 may filter each site's data from the study data and then, in operation 425 , process the metric data for the sites to determine metric values.
- the metric values may be normalized based on metric risk profiles.
- each metric value will be normalized by a specific metric risk profile, but it is also possible that the same metric risk profile will be used to normalize more than one metric value.
- the normalized site-metric risk indicators may be aggregated into a site-level quality score for each site according to an aggregation algorithm.
- FIGS. 4B and 4C illustrate how higher-level quality scores can be generated based on the site-level metric risk indicators calculated in operation 430 .
- “Higher-level” in this case refers to groupings or geographies that are more inclusive than site level, e.g., regional level, state level, country level, study level, etc. Groupings by geographic region are illustrative, but any relevant groupings having a common element may apply. For example, higher-level site quality scores may be generated for groups of sites managed by each CRA in the study.
- FIG. 4B illustrates the process generally associated with FIG. 2C in which a quality score and risk indicator can be calculated for a specific metric, e.g., Metric1, from a plurality of sites.
- the data for Metric1 are processed for each of the sites to determine metric values.
- the metric values may be normalized based on the Metric1 risk profile into site-metric risk indicators.
- the site-metric risk indicators may be combined or aggregated into a quality score for the multiple sites.
- a risk indicator for the multiple sites for Metric1 may be calculated from the quality score.
- FIG. 4C illustrates the process generally associated with FIG. 2D in which a quality score and risk indicator can be calculated for a number of metrics, e.g., Metric1, Metric2, . . . , Metric5, from a plurality of sites.
- the data for the metrics may be processed for each of the sites to determine metric values.
- the metrics may be normalized into site-metric risk indicators based on the specific metric risk profiles.
- the site-metric risk indicators may be combined or aggregated into an overall quality score for the multiple sites and metrics.
- an overall risk indicator for the multiple sites and metrics may be calculated from the overall quality score.
- Risk assessment apparatus 10 may have a graphical interface for displaying study and site data and risk indicators.
- FIG. 5 shows an example of a site-level view of quality data scores and risk indicators for ten sites in one study.
- the interface may include four main parts, 510 , 520 , 530 , and 540 .
- Part 510 is a pie chart showing at a glance the percentage of sites falling within each risk indicator designation ( 512 , 514 , 516 ) or having insufficient data ( 518 ) for the overall quality score.
- Part 520 may show the values for a certain metric, in this case, Subject Visit to eCRF Entry Time, for each site, and may also show the risk-indicator thresholds for that metric.
- Part 530 may show the values and quality scores numerically for each of the five metrics for each of the sites in the study, as well as the site-level quality score for each site (“Site Quality Score”), which is a combination of the metric risk indicators for the five metrics for that study. Part 530 may also pattern or color code according to risk indicator the metric risk indicators and the Site Quality Score. Part 530 may also include information regarding the number of subjects within each site.
- Part 540 may be a filter area, by which the user may select data that satisfy specific criteria, such as country, site name, and metric name, and the information shown in parts 510 , 520 , and 530 could change based on those filters.
- Part 510 shows the values of five metrics, auto-query rate, data management (DM) query answer wait time, subject visit to eCRF entry time, screen failure rate, and early termination rate, along with the metric risk indicators for those metrics and the site-level quality scores for the sites (although data for only seven sites are actually shown).
- Part 520 shows the values of one of the metrics, subject visit to eCRF entry time, for all ten sites, and includes the risk indicator for each site for that metric.
- FIG. 6 shows another site-level view of quality data scores and risk indicators for the ten sites in FIG. 5 .
- the interface may include three main parts, 610 , 620 , and 630 .
- Part 610 is a pattern-coded (alternatively, color-coded) chart of all the sites showing at a glance the risk indicator for each site.
- An additional pattern/color may be used to denote the specific site chosen to view in Part 620 , here Greenport Memorial Hospital.
- the size of the rectangles in Part 610 may indicate size (e.g., number of subjects) of the particular study.
- Part 620 may show the values of the metrics for the specific site chosen in Part 610 , and into which risk regions those values fall.
- Part 620 may also show the risk-indicator thresholds for each metric.
- Part 630 may be a filter area, by which the user may select data that satisfy specific criteria, such as country, site name, and metric name, and the information shown in parts 610 and 620 could change based on those filters.
- the example shown in FIG. 6 continues the one shown in FIG. 5 , so the United States is chosen as the filter country and all ten of the sites within the United States are displayed in Part 610 .
- Greenport Memorial Hospital is selected in Part 610 as shown by the different pattern for that site.
- the values of the five metrics, auto-query rate, data management (DM) query answer wait time, subject visit to eCRF entry time, screen failure rate, and early termination rate, are displayed in Part 620 , along with the risk-indicator thresholds for those metrics for that site.
- Auto-query rate, screen failure rate, and early termination rate have double-sided metric risk profiles, such as metric risk profile 302 shown in FIG.
- the value of auto-query rate is 23, which is low risk
- the two medium-risk-indicator thresholds are 70 and 18, and the two high-risk-indicator thresholds are 120 and 12.
- other embodiments of the invention may have more or less than three risk indicator designations and the risk-indicator thresholds may differ from these values, depending on the study, user (e.g., the sponsor or CRO), or risk assessment apparatus designer.
- FIG. 7 shows a country-level view of quality scores and risk indicators for one study.
- the interface may include three main parts, 710 , 720 , and 730 .
- Part 710 may include a world map, which may show at a glance country-level risk based on pattern or letter or color coding.
- Part 720 may show the quality scores numerically for each of five metrics for each of the countries in the study, each of which is an aggregation of the site-metric risk indicators as illustrated in FIG. 2C .
- Part 720 may also show the overall quality score for each country, which is an aggregation of the site-metric risk indictors for that study, as illustrated in FIG. 2D .
- Part 720 may also pattern or color code according to risk indicator the metric quality scores and the overall quality score. Part 720 may also include information regarding the number of sites for each country. Part 730 may be a filter area, by which the user may select data that satisfy specific criteria, such as country, site name, and metric name, and the information shown in parts 710 and 720 could change based on those filters.
- a metric quality score or an overall quality score of 85 or less generates a high risk indicator, a score between 85 and 95 generates a medium risk indicator, and a score above 95 generates a low risk indicator.
- other embodiments of the invention may have more or less than three risk indicator designations and the risk-indicator thresholds may differ from 85 and 95, depending on the study, user (e.g., the sponsor or CRO), or risk assessment apparatus designer.
- FIG. 8 shows an “executive” or overall view of quality scores and risk indicators for several studies.
- the interface may include three main parts, 810 , 820 , and 830 .
- Part 810 may include a bar graph, in which the overall study-level quality score is shown relative to risk-indicator thresholds, and the bars of the graph may be pattern or color coded according to risk indicator.
- Part 820 may show the quality scores numerically for each of five metrics for five studies S1 through S5, which may be derived as illustrated in FIG. 2C , as well as the overall quality score for each study, which may be an aggregation of the site-metric risk indicators for that study, which may be derived as illustrated in FIG. 2D .
- Part 820 may also pattern or color code according to risk indicator the metric quality scores and the overall quality scores. Part 820 may also include information regarding the number of sites for each study, in which clinical trial phase the study was performed, and in which therapeutic area the study was classified. Part 830 is a filter area, by which the user may select studies that satisfy specific criteria, such as clinical trial phase, therapeutic area, or drug/study name, and the information shown in parts 810 and 820 could change based on those filters.
- an overall study quality score of 85 or less generates a high risk indicator, a score between 85 and 95 generates a medium risk indicator, and a score above 95 generates a low risk indicator.
- other embodiments of the invention may have more or less than three risk indicator designations and the risk-indicator thresholds may differ from 85 and 95, depending on the study, user (e.g., the sponsor or CRO), or risk assessment apparatus designer.
- Clinical data entered into an EDC system by clinicians, study coordinators, or other site personnel may be remotely analyzed in order to identify issues with the quality of that data and, in turn, with the quality of the site conducting the clinical trial.
- metadata generated in conjunction with clinical data entered into the EDC system, on its own or in relationship to the clinical data may also be useful in identifying issues with the quality of the site conducting the clinical trial. Examples of the usefulness of harnessing clinical data and/or its associated metadata will be apparent in the following inventive examples of site quality metrics.
- a “query” may be generated in a number of ways, such as to catch a data entry error made by clinical site personnel or to question the value or validity of datapoints (a “datapoint” is typically any data entry opportunity) based on either their value only or their value relative to other entered data points (which may or may not be true errors).
- EDC programs may recognize such entries and may automatically log such queries and prompt the site personnel to correct the entry. For example, if a subject's age is to be entered, a query may be configured to be generated automatically if the age entered is too young or too old or not a number.
- an EDC program may be programmed by the user (e.g., the sponsor or CRO) or by the EDC vendor, the types of queries generated may vary from study to study. Moreover, not every datapoint nor every data entry error generates a query. In any case, the EDC program may be configured to track the number of automatic queries that are generated during data entry and may determine the rate of these automatically generated queries (or “auto-queries”). Embodiments of the present invention may identify and solve data quality issues based on a meaningful auto-query rate, i.e., an auto-query rate that is generated after a minimum number of datapoints is collected, for example 300.
- a meaningful auto-query rate i.e., an auto-query rate that is generated after a minimum number of datapoints is collected, for example 300.
- the auto-query rate for a given site may be meaningfully compared to that of another site, it may be desirable that the auto-query rate for those sites exceed a minimum quantity of datapoints.
- newer data may generally be considered on a rolling basis (e.g., the last 1000 datapoints) so as to allow for a more sensitive identification of emerging issues. Otherwise, a recent change in the auto-query rate could be more difficult to identify if it were combined with all of the data for the site.
- the auto-query rate may be subject to a double-sided metric risk profile, similar to profile 302 shown in FIG. 3B .
- the benchmark chosen may be historic, in which case it may be based on historic data for clinical trials in a specific therapeutic area or clinical trial phase or based on other data preceding the current study.
- One benchmark often chosen may be the historic mean, which is typically the 50th percentile (if the distribution of auto-queries is statistically normal).
- a historic data distribution may be set up that includes the 2nd, 5th, 95th, and 98th percentiles, as described in FIG. 3A .
- the benchmark could be modified to be the study mean, and the risk-indicator thresholds for the modified distribution would be the values for the historical 2nd, 5th, 95th, and 98th percentiles multiplied by the ratio of the study mean to the historic mean, as described with respect to FIGS. 3A-3C .
- the low-risk region may be between the modified 5th and 95th percentiles
- the medium-risk region may be between the modified 2nd and 5th percentiles on the low end and the modified 95th and 98th percentiles on the high end
- the high-risk region may be below the modified 2nd percentile on the low end and above the modified 98th percentile on the high end.
- EDC program In typical clinical trials, certain personnel known as data managers may review data entered into the EDC program. If a data manager identifies an issue such as an inconsistency or deficiency with entered data, he or she may manually enter a query into the EDC program concerning the entered data. The EDC program may flag those manual queries for site personnel to respond to. The EDC program can track the mean time taken by site personnel to respond to the data manager's query.
- the DM query answer wait time may be subject to a single-sided metric risk profile, similar to profile 301 shown in FIG. 3C .
- the benchmark chosen for DM query answer wait time may be historic, e.g., the historic mean, and the benchmark and metric risk profile may be modified by current study data.
- low, medium, and high risk indicator designations may be chosen, with the same or different percentile assignments.
- the actual calculation for this metric may comprise the mean DM query answer wait time.
- mean DM query answer wait time may be calculated only for queries that have actually been answered and for unanswered queries that have been pending more than a certain number of days, e.g., 15 (so as to not skew results caused by pending queries of short duration).
- the DM query answer wait time can be set at the number of days pending until the query is answered, at which time it assumes its actual value.
- a minimum of 10 answered queries may be imposed, as well as looking at only the 20 most recently answered queries, so as to identify emerging issues, as was mentioned with respect to auto-query rate.
- the choices of 15 pending days, 10 minimum answered queries, and the 20 most recently answered queries are examples only; they may be changed to lower or higher numbers.
- a study-level metric for DM query answer wait time may be calculated as follows: find the median of the site-level metrics for DM query answer wait time. “Median” may be chosen for study-level data rather than “mean,” which may be chosen for site-level data, because extreme outlier values (e.g., >150 days) may have a greater impact on the study-level metric if the mean were taken rather than the median. Outliers at a particular site, however, should be identified, but they might be masked were the median used at the site level rather than the mean.
- subject visit to eCRF entry time measures the delay from the date of a subject visit to the date that the subject visit is entered into the EDC program, as reflected by the metadata timestamp recorded when the subject visit date is entered.
- a mean value may be determined for every site that has sufficient data to calculate a value for this metric.
- the subject visit to eCRF entry time may also be subject to a single-sided metric risk profile, similar to profile 301 shown in FIG. 3C .
- the benchmark chosen for subject visit to eCRF entry time may be historic, e.g., the historic mean, and the benchmark and metric risk profile may be modified by current study data.
- low, medium, and high risk indicator designations may be chosen, with the same or different percentile assignments. The actual calculation for this metric may comprise the mean subject visit to eCRF entry time.
- a study-level metric for subject visit to eCRF entry time may be calculated using the median of the site-level metrics for subject visit to eCRF entry time, just as was done for study-level DM query answer wait time.
- the median may be chosen for study-level data rather than the mean, because outliers within a site should be noticed (using the mean), but a site outlier in the whole study does not have as much weight, so the median can be used.
- Screen failure rate reflects the percentage of subjects that were initially determined to be eligible for a study, but were subsequently dropped from the study prior to being randomized. Screening may begin when a subject is first considered for a clinical trial, and is entered into the EDC program. A site may go through weeks of ensuring that a subject remains eligible for a study as determined by the study's inclusion and exclusion criteria. A high screen failure rate can indicate a site quality issue: a site could be taking advantage of the sponsor's paying for procedures and care during screening. A screen failure rate that is too high especially compared to other sites in the study suggests the site may have been screening too broadly, and may not be adhering to the study protocol with regard to identifying patients to screen.
- a screen failure rate that is too low may be an indication that those variables that are used to determine eligibility are not being fully and/or accurately identified.
- this metric may be subject to a double-sided metric risk profile, similar to profile 302 shown in FIG. 3B .
- low, medium, and high risk indicator designations may be chosen, with the same or different percentile assignments.
- the benchmark chosen for screen failure rate is not typically historic. Instead, the benchmark may be a site-level “p-score,” which is similar to a statistical “p-value.” The site-level p-score may represent the probability that a site's screen failure rate would be less than the current site's screen failure rate, assuming that screen failures are expected to occur at the same rate as the current study-level rate.
- the site-level p-score has a value from 0 to 100, where sites with a screen failure rate equal to the study-level rate will have a p-score value of 50, sites with high screen failure rates will have p-scores approaching 100, and sites with low screen failure rates will have p-scores approaching 0.
- the site-level p-score may use a normal approximation to a binomial distribution.
- a study-level metric for screen failure rate may be calculated as:
- Early termination rate measures the rate at which subjects have been randomized into a study and have then dropped out before the study has been completed.
- a low early termination rate may indicate that a site is acting improperly to retain subjects who do not meet the inclusion or exclusion criteria of a study.
- a high early termination rate may indicate that a site is mismanaging subjects in earlier stages of the study process, for example, by not informing the subjects regarding the study requirements.
- Early termination rate may be treated similar to screen failure rate in terms of metric risk profile (double-sided), number of risk indicator designations, and percentile assignments. Early termination rate may also use a site-level p-score rather than historical data for its benchmark. As with screen failure rate, the site-level p-score may use a normal approximation to a binomial distribution.
- a study-level metric for screen failure rate may be calculated as follows:
- remote monitoring of various metrics could be combined with on-site monitoring or site-based feedback in order to provide a dynamic measure of how important each metric is and then weight the metrics accordingly. For example, if a metric, a site quality score, or other higher-level quality score falls within a medium or high risk indicator, a correlation between that risk indicator and an actual quality or risk issue at the site could be determined via confirmation of the actual site conditions, such as the existence of a quality or risk issue. Such confirmation could be provided by a site monitor visit to the site or by an action or step taken at the site itself (see operation 450 in FIG. 4A ).
- Operation 450 could also include a confirmation of the absence of an actual quality or risk issue by a site monitor visit to the site or by an action or step taken at the site itself. Such confirmations may provide correlations between risk indicators and the site such that both false positives and false negatives may be identified. In addition, those metrics which gave rise to a medium or high risk indicator may be identified and correlated.
- a score would be one such way to quickly judge the quality of a clinical trial site. Such a score could take far ranging data and countless details and boil that information down in a single score that could be applied to a trial site, a region of trial sites, etc. That score would give an administrator a quick overview of the quality of clinical trials in a brief glance.
- methods and apparatuses are described that may be used to normalize data site metrics and combine a plurality of the metrics to determine a site-level quality score. Normalization may be accomplished by applying metric risk profiles to the metrics. These methods allow clinical trial administrators to review data from multiple clinical trials and clinical trial sites and determine at a glance whether a trial site may be risky or may be providing bad data. Such problem sites can then be addressed as quickly and as efficiently as possible. These methods reduce the cost of monitoring a clinical trial because they focus the monitor's attention on those sites that may not be performing as well as needed. Note that although the methods and apparatuses described herein have been described with respect to clinical trials for drugs, they are applicable to clinical trials for other items such as medical devices, vaccines, and biologics. They are also applicable to systems other than clinical trials that have distributed sites collecting data and for which the integrity of the data and the sites may be monitored.
- these techniques provide centralized, remote identification of risk associated with the systems being monitored.
- these techniques provide the clinical trial sponsor a holistic, quantitative, unbiased profile of each clinical trial site in terms of the quality of the trials being conducted by the site to proactively identify problematic clinical sites.
- aspects of the present invention may be embodied in the form of a system, a method, or a computer program product. Similarly, aspects of the present invention may be embodied as hardware, software or a combination of both. Aspects of the present invention may be embodied as a computer program product saved on one or more computer-readable media in the form of computer-readable program code embodied thereon.
- the computer-readable medium may be a computer-readable signal medium or a computer-readable storage medium.
- a computer-readable storage medium may be, for example, an electronic, optical, magnetic, electromagnetic, infrared, or semiconductor system, apparatus, or device, or any combination thereof.
- a computer-readable signal medium may include a propagated data signal with computer-readable program code embodied therein, for example, in baseband or as part of a carrier wave. Such a propagated signal may take any of a variety of forms, including, but not limited to, electromagnetic, optical, or any suitable combination thereof.
- a computer-readable signal medium may be any computer-readable medium that is not a computer-readable storage medium and that can communicate, propagate, or transport a program for use by or in connection with an instruction execution system, apparatus, or device.
- Computer program code in embodiments of the present invention may be written in any suitable programming language.
- the program code may execute on a single computer, or on a plurality of computers.
- the computer may include a processing unit in communication with a computer-usable medium, wherein the computer-usable medium contains a set of instructions, and wherein the processing unit is designed to carry out the set of instructions.
Abstract
Description
where L, M, and H are the quantity of metric values, corresponding to one site of a study, having low, medium, or high designations, respectively. Using equation (1), site-
where a, b, and c are coefficients between 0 and 1 that weight the effects of the three different risk indicator designations. Note that
where a, b, and c are coefficients that weight the effects of the three different risk designations and the value K determines the range of the score.
| TABLE 1 |
| Site-Level Quality Scores and Risk Indicators |
| for Possible Combinations of Five |
| #L |
| 5 | 4 | 4 | 3 | 1 | 1 | 1 | |
| | 0 | 1 | 0 | 1 | 2 | 2 | 3 |
| | 0 | 0 | 1 | 0 | 1 | 2 | 1 |
| SLQS | 100.00 | 90.00 | 80.00 | 87.50 | 50.00 | 40.00 | 50.00 |
| SLRI | Low | Medium | High | Medium | High | High | High |
Table 1 also shows that site-level quality scores need not be unique.
If the risk profile utilized in
| TABLE 2 |
| Country-Level Quality Scores for Five Metrics |
| Overall | Metric1 | Metric2 | Metric3 | Metric4 | Metric5 | |
| #L | 76 | 16 | 13 | 15 | 17 | 15 |
| |
6 | 1 | 2 | 1 | 0 | 2 |
| |
3 | 0 | 2 | 1 | 0 | 0 |
| Quality | 92.942 | 97.061 | 82.351 | 91.181 | 100.001 | 94.121 |
| Score | ||||||
| Risk | Medium | Low | High | Medium | Low | Medium |
| Indicator | ||||||
| 1Quality score derived using |
||||||
| 2Quality score derived using |
||||||
As an example, if there is one patient at the site and that one patient drops out, the screen failure rate would be 100%. A second site with 10 patients, all of whom drop out, would also have a 100% screen failure rate. The use of a p-score will assess these sites differently, however, because the p-score considers not just the screen failure rate, but the number of patients that contribute to that rate. In this example, the site with 10 patients would have a more extreme p-score than the site with just 1 patient.
Similar to screen failure rate, this metric will be sensitive to both the value of the observed rate for a site and the number of patients that contribute to that rate.
the terms in the numerator could change depending on which metric has which risk indicator. For example, if Metric3 is determined to be very important, but Metric1 is determined to be only half as important, then the L, M, and H associated with Metric3 would carry full weight (e.g., aL3+bM3+cH3 in the numerator), but the L, M, and H associated with Metric1 would be counted only half as much (e.g., 0.5*(aL1+bM1+cH1) in the numerator). This modified aggregation may be rewritten more generally as:
where mi is the weighting for the ith metric.
Claims (29)
Priority Applications (7)
| Application Number | Priority Date | Filing Date | Title |
|---|---|---|---|
| US13/679,533 US8706537B1 (en) | 2012-11-16 | 2012-11-16 | Remote clinical study site monitoring and data quality scoring |
| CN201380059790.4A CN104956380B (en) | 2012-11-16 | 2013-11-14 | For the method and apparatus of remote site monitoring |
| PCT/US2013/070138 WO2014078563A1 (en) | 2012-11-16 | 2013-11-14 | Method and apparatus for remote site monitoring |
| KR1020157012745A KR101781705B1 (en) | 2012-11-16 | 2013-11-14 | Method and apparatus for remote site monitoring |
| EP13855172.6A EP2852923A4 (en) | 2012-11-16 | 2013-11-14 | Method and apparatus for remote site monitoring |
| CA2890822A CA2890822C (en) | 2012-11-16 | 2013-11-14 | Method and apparatus for remote site monitoring |
| US14/186,791 US20140236668A1 (en) | 2012-11-16 | 2014-02-21 | Method and apparatus for remote site monitoring |
Applications Claiming Priority (1)
| Application Number | Priority Date | Filing Date | Title |
|---|---|---|---|
| US13/679,533 US8706537B1 (en) | 2012-11-16 | 2012-11-16 | Remote clinical study site monitoring and data quality scoring |
Related Child Applications (1)
| Application Number | Title | Priority Date | Filing Date |
|---|---|---|---|
| US14/186,791 Continuation-In-Part US20140236668A1 (en) | 2012-11-16 | 2014-02-21 | Method and apparatus for remote site monitoring |
Publications (1)
| Publication Number | Publication Date |
|---|---|
| US8706537B1 true US8706537B1 (en) | 2014-04-22 |
Family
ID=50481925
Family Applications (1)
| Application Number | Title | Priority Date | Filing Date |
|---|---|---|---|
| US13/679,533 Active US8706537B1 (en) | 2012-11-16 | 2012-11-16 | Remote clinical study site monitoring and data quality scoring |
Country Status (6)
| Country | Link |
|---|---|
| US (1) | US8706537B1 (en) |
| EP (1) | EP2852923A4 (en) |
| KR (1) | KR101781705B1 (en) |
| CN (1) | CN104956380B (en) |
| CA (1) | CA2890822C (en) |
| WO (1) | WO2014078563A1 (en) |
Cited By (26)
| Publication number | Priority date | Publication date | Assignee | Title |
|---|---|---|---|---|
| US20140236668A1 (en) * | 2012-11-16 | 2014-08-21 | Medidata Solutions, Inc. | Method and apparatus for remote site monitoring |
| US20140249835A1 (en) * | 2013-02-08 | 2014-09-04 | Parexel International Corporation | Methods and apparatus for data-driven monitoring |
| US20140375650A1 (en) * | 2013-06-24 | 2014-12-25 | Quintiles Transnational Corporation | Systems and methods for data visualization |
| US20160275269A1 (en) * | 2015-03-20 | 2016-09-22 | International Drug Development Institute | Methods for central monitoring of research trials |
| US20170103190A1 (en) * | 2015-10-09 | 2017-04-13 | Algorithm Inc | System and method for evaluating risks of clinical trial conducting sites |
| US20170169380A1 (en) * | 2015-12-14 | 2017-06-15 | Wipro Limited | Method and System for Determining Quality Level of Performance Data Associated With an Enterprise |
| EP3239915A1 (en) * | 2016-04-28 | 2017-11-01 | Honeywell International Inc. | Systems and methods for displaying a dynamic risk level indicator of an atm site or other remote monitoring site on a map for improved remote monitoring |
| US20180240553A1 (en) * | 2015-09-04 | 2018-08-23 | Remarque Systems, Inc. | Risk-Based Monitoring of Clinical Data |
| US10515099B2 (en) | 2015-04-07 | 2019-12-24 | International Business Machines Corporation | Medical clinical trial site identification |
| US20200082920A1 (en) * | 2017-05-09 | 2020-03-12 | Analgesic Solutions | Systems and Methods for Visualizing Clinical Trial Site Performance |
| US10610624B2 (en) | 2013-03-14 | 2020-04-07 | Smith & Nephew, Inc. | Reduced pressure therapy blockage detection |
| CN112785021A (en) * | 2021-01-28 | 2021-05-11 | 联仁健康医疗大数据科技股份有限公司 | Reservation request response method and device, electronic equipment and storage medium |
| US11133101B2 (en) * | 2018-05-23 | 2021-09-28 | Tata Consultancy Services Limited | Method and system for data driven cognitive clinical trial feasibility program |
| US20210326784A1 (en) * | 2018-12-17 | 2021-10-21 | Isd Inc. | Method for analyzing risk of cooperrator supply chain |
| US20210374645A1 (en) * | 2013-06-28 | 2021-12-02 | Healthtap, Inc. | Systems and methods for improving communication efficiency and reducing data redundancy in a computerized platform |
| US11315681B2 (en) | 2015-10-07 | 2022-04-26 | Smith & Nephew, Inc. | Reduced pressure therapy device operation and authorization monitoring |
| US11369730B2 (en) | 2016-09-29 | 2022-06-28 | Smith & Nephew, Inc. | Construction and protection of components in negative pressure wound therapy systems |
| US11392670B1 (en) * | 2011-12-09 | 2022-07-19 | Iqvia Inc. | Systems and methods for streaming normalized clinical trial capacity information |
| US11494680B2 (en) * | 2018-05-15 | 2022-11-08 | Medidata Solutions, Inc. | System and method for predicting subject enrollment |
| US20220359048A1 (en) * | 2021-05-05 | 2022-11-10 | Iqvia Inc. | Ai and ml assisted system for determining site compliance using site visit report |
| US11602461B2 (en) | 2016-05-13 | 2023-03-14 | Smith & Nephew, Inc. | Automatic wound coupling detection in negative pressure wound therapy systems |
| US20230111459A1 (en) * | 2021-10-13 | 2023-04-13 | Johnson Controls Tyco IP Holdings LLP | Building system for building equipment with external model integration |
| US11715054B1 (en) | 2019-12-11 | 2023-08-01 | Wells Fargo Bank, N.A. | Computer systems for meta-alert generation based on alert volumes |
| US11712508B2 (en) | 2017-07-10 | 2023-08-01 | Smith & Nephew, Inc. | Systems and methods for directly interacting with communications module of wound therapy apparatus |
| US11793924B2 (en) | 2018-12-19 | 2023-10-24 | T.J.Smith And Nephew, Limited | Systems and methods for delivering prescribed wound therapy |
| US11961596B2 (en) | 2022-06-15 | 2024-04-16 | Iqvia Inc. | Systems and methods for streaming normalized clinical trial capacity information |
Families Citing this family (7)
| Publication number | Priority date | Publication date | Assignee | Title |
|---|---|---|---|---|
| CN106713233B (en) * | 2015-11-13 | 2020-04-14 | 国网智能电网研究院 | Network security state judging and protecting method |
| CN108133300B (en) * | 2016-11-30 | 2021-10-29 | 北京经纬传奇医药科技有限公司 | Clinical test quality evaluation system and method thereof |
| JP6858105B2 (en) * | 2017-09-19 | 2021-04-14 | 株式会社富士通アドバンストエンジニアリング | Information processing programs, information processing methods, and information processing equipment |
| KR102092093B1 (en) * | 2018-09-11 | 2020-03-23 | 아토리서치(주) | Method and system for real time multi metric monitoring |
| CN111080159A (en) * | 2019-12-27 | 2020-04-28 | 嘉兴太美医疗科技有限公司 | Risk monitoring method and system for quality supervision of clinical trial research center |
| US11734431B2 (en) * | 2020-04-27 | 2023-08-22 | Saudi Arabian Oil Company | Method and system for assessing effectiveness of cybersecurity controls in an OT environment |
| CN113360798B (en) * | 2021-06-02 | 2024-02-27 | 北京百度网讯科技有限公司 | Method, device, equipment and medium for identifying flooding data |
Citations (72)
| Publication number | Priority date | Publication date | Assignee | Title |
|---|---|---|---|---|
| US6353767B1 (en) * | 2000-08-25 | 2002-03-05 | General Electric Company | Method and system of confidence scoring |
| US20020078175A1 (en) * | 2000-12-15 | 2002-06-20 | Wallace Thomas Tracy | Scorecard wizard |
| US20020128861A1 (en) | 2001-01-05 | 2002-09-12 | Lau Lee Min | Mapping clinical data with a health data dictionary |
| US6496827B2 (en) | 1997-05-12 | 2002-12-17 | Mlk Software | Methods and apparatus for the centralized collection and validation of geographically distributed clinical study data with verification of input data to the distributed system |
| US20030014287A1 (en) * | 2001-07-02 | 2003-01-16 | Dell Products, L.P. | Continuity of supply risk and cost management tool |
| US20040064346A1 (en) * | 2002-10-01 | 2004-04-01 | Reto Schneider | Method and system for gathering information relating to risks |
| US20040064341A1 (en) | 2002-09-27 | 2004-04-01 | Langan Pete F. | Systems and methods for healthcare risk solutions |
| US20040122756A1 (en) * | 2002-12-23 | 2004-06-24 | Creeden Denis Michael | Methods and systems for managing risk management information |
| US20040210574A1 (en) * | 2003-04-01 | 2004-10-21 | Amanda Aponte | Supplier scorecard system |
| US6856973B1 (en) * | 1999-12-29 | 2005-02-15 | General Electric Capital Corporation | Methods and systems for assessing creditworthiness of a country |
| US6879970B2 (en) * | 2001-04-02 | 2005-04-12 | Invivodata, Inc. | Apparatus and method for prediction and management of subject compliance in clinical research |
| US6912502B1 (en) * | 1999-12-30 | 2005-06-28 | Genworth Financial, Inc., | System and method for compliance management |
| US20050154628A1 (en) * | 2004-01-13 | 2005-07-14 | Illumen, Inc. | Automated management of business performance information |
| US20050182663A1 (en) * | 2004-02-18 | 2005-08-18 | Klaus Abraham-Fuchs | Method of examining a plurality of sites for a clinical trial |
| US20050182658A1 (en) * | 2004-02-18 | 2005-08-18 | Klaus Abraham-Fuchs | Method of improving a clinical study |
| US20050192963A1 (en) * | 2002-02-26 | 2005-09-01 | Tschiegg Mark A. | Risk management information interface system and associated methods |
| US20050256380A1 (en) * | 2004-05-14 | 2005-11-17 | Accelere, Inc. | Patient recruitment method and system |
| US7006992B1 (en) * | 2000-04-06 | 2006-02-28 | Union State Bank | Risk assessment and management system |
| US7054823B1 (en) * | 1999-09-10 | 2006-05-30 | Schering Corporation | Clinical trial management system |
| US20060161456A1 (en) * | 2004-07-29 | 2006-07-20 | Global Managed Care Solutions, d/b/a Med-Vantage® , a corporation | Doctor performance evaluation tool for consumers |
| US20060287997A1 (en) | 2005-06-17 | 2006-12-21 | Sooji Lee Rugh | Pharmaceutical service selection using transparent data |
| US20070016542A1 (en) * | 2005-07-01 | 2007-01-18 | Matt Rosauer | Risk modeling system |
| US20070061393A1 (en) * | 2005-02-01 | 2007-03-15 | Moore James F | Management of health care data |
| US7213037B2 (en) * | 2003-01-13 | 2007-05-01 | I2 Technologies Us, Inc. | Master data management system for centrally managing cached data representing core enterprise reference data maintained as locked in true state read only access until completion of manipulation process |
| US20070150313A1 (en) * | 2004-02-18 | 2007-06-28 | Klaus Abraham-Fuchs | Method for evaluating the quality of electronically stored, particularly medical, knowledge data |
| US7251609B1 (en) * | 1999-04-29 | 2007-07-31 | The Trustees Of Boston University | Method for conducting clinical trials over the internet |
| US20080077457A1 (en) * | 2004-02-03 | 2008-03-27 | Swiss Reinsurance Company | System and Method for Automated Risk Determination and/or Optimization of the Service Life of Technical Facilities |
| US7353238B1 (en) * | 1998-06-12 | 2008-04-01 | Outcome Sciences, Inc. | Apparatus and methods for determining and processing medical outcomes |
| US7359865B1 (en) * | 2001-11-05 | 2008-04-15 | I2 Technologies Us, Inc. | Generating a risk assessment regarding a software implementation project |
| US7386466B2 (en) * | 2000-05-17 | 2008-06-10 | Tvc International Inc. | Continuously updated data processing system and method for measuring and reporting on value creation performance that supports real-time benchmarking |
| US20080140514A1 (en) * | 2006-12-11 | 2008-06-12 | Grant Thornton Llp | Method and system for risk evaluation and management |
| US20080154637A1 (en) | 2006-12-22 | 2008-06-26 | Capelli Christopher C | Methods for risk-adjusted performance analysis |
| US7409357B2 (en) * | 2002-12-20 | 2008-08-05 | Accenture Global Services, Gmbh | Quantification of operational risks |
| US7415447B2 (en) * | 2001-04-02 | 2008-08-19 | Invivodata, Inc. | Apparatus and method for prediction and management of participant compliance in clinical research |
| US20080270181A1 (en) * | 2007-04-27 | 2008-10-30 | Rosenberg Michael J | Method and system for collection, validation, and reporting of data and meta-data in conducting adaptive clinical trials |
| US20080270420A1 (en) | 2007-04-27 | 2008-10-30 | Rosenberg Michael J | Method and System for Verification of Source Data in Pharmaceutical Studies and Other Applications |
| US20080319726A1 (en) * | 2007-06-19 | 2008-12-25 | Schlumberger Technology Corporation | System and method for performing oilfield simulation operations |
| US7483917B2 (en) * | 2002-02-27 | 2009-01-27 | Industrial Interfaces Limited | Risk mapping system |
| US7536405B2 (en) * | 2002-02-26 | 2009-05-19 | Global Asset Protection Services, Llc | Risk management information interface system and associated methods |
| US20090138306A1 (en) * | 2007-09-28 | 2009-05-28 | Johnson Controls Technology Company | Facility risk assessment systems and methods |
| US7571109B2 (en) * | 2006-07-14 | 2009-08-04 | Fawls Robert A | System and method for assessing operational process risk and quality by calculating operational value at risk |
| US7606795B2 (en) * | 2007-02-08 | 2009-10-20 | International Business Machines Corporation | System and method for verifying the integrity and completeness of records |
| US20090276259A1 (en) * | 2008-05-02 | 2009-11-05 | Karol Bliznak | Aggregating risk in an enterprise strategy and performance management system |
| US7644026B2 (en) * | 2006-10-25 | 2010-01-05 | Hewlett-Packard Development Company, L.P. | Ranking systems based on a risk |
| US7698148B2 (en) * | 2003-09-12 | 2010-04-13 | Raytheon Company | Web-based risk management tool and method |
| US7711670B2 (en) * | 2002-11-13 | 2010-05-04 | Sap Ag | Agent engine |
| US7752057B2 (en) * | 2003-09-22 | 2010-07-06 | Medidata Solutions, Inc. | System and method for continuous data analysis of an ongoing clinical trial |
| US20100198630A1 (en) * | 2009-01-30 | 2010-08-05 | Bank Of America Corporation | Supplier risk evaluation |
| US7853476B2 (en) * | 2006-01-30 | 2010-12-14 | Bruce Reiner | Method and apparatus for generating a clinician quality assurance scorecard |
| US20100324936A1 (en) | 2009-04-22 | 2010-12-23 | Suresh-Kumar Venkata Vishnubhatla | Pharmacy management and administration with bedside real-time medical event data collection |
| US20110077958A1 (en) | 2009-09-24 | 2011-03-31 | Agneta Breitenstein | Systems and methods for clinical, operational, and financial benchmarking and comparative analytics |
| US7921125B1 (en) * | 2010-07-20 | 2011-04-05 | Numoda Technologies, Inc. | Virtual data room with access to clinical trial status reports based on real-time clinical trial data |
| US7937423B2 (en) * | 2005-11-23 | 2011-05-03 | Ultra-Scan Corporation | Systems and methods of conducting clinical research |
| US20110161245A1 (en) * | 2005-11-03 | 2011-06-30 | Equitynet, Llc | Electronic System for Analyzing the Risk of an Enterprise |
| US20110191138A1 (en) * | 2010-02-01 | 2011-08-04 | Bank Of America Corporation | Risk scorecard |
| US20110313782A1 (en) * | 2010-06-16 | 2011-12-22 | Parexel International Corporation | Integrated clinical trial workflow system |
| US8086708B2 (en) * | 2005-06-07 | 2011-12-27 | International Business Machines Corporation | Automated and adaptive threshold setting |
| US20120053995A1 (en) * | 2010-08-31 | 2012-03-01 | D Albis John | Analyzing performance and setting strategic targets |
| US8140383B2 (en) * | 2007-12-17 | 2012-03-20 | Sap Ag | Derived and automated key performance indicator reports |
| US20120096005A1 (en) * | 2010-10-19 | 2012-04-19 | Innovo Commerce, LLC | System and method for remote source data verification |
| US8180710B2 (en) * | 2007-09-25 | 2012-05-15 | Strichman Adam J | System, method and computer program product for an interactive business services price determination and/or comparison model |
| US8185430B2 (en) * | 2009-01-30 | 2012-05-22 | Bank Of America Corporation | Supplier stratification |
| US20120150570A1 (en) * | 2009-08-20 | 2012-06-14 | Ali Samad-Khan | Risk assessment/measurement system and risk-based decision analysis tool |
| US20120226621A1 (en) * | 2011-03-03 | 2012-09-06 | Ecolab Usa Inc. | Modeling risk of foodborne illness outbreaks |
| US20120296695A1 (en) * | 2011-05-19 | 2012-11-22 | Aon Global Risk Research Limited | Risk Portal Including Index Tool |
| US20120323589A1 (en) * | 2011-06-17 | 2012-12-20 | Sanjay Udani | Methods and systems for assuring compliance |
| US20130013332A1 (en) | 2011-07-07 | 2013-01-10 | Georgetown University | System and method for performing pharmacovigilance |
| US20130060599A1 (en) * | 2011-09-01 | 2013-03-07 | Aon Consulting, Inc. | People Risk Portal |
| US8423388B1 (en) * | 2012-01-17 | 2013-04-16 | Aon Global Risk Research Limited | GUI for risk profiles |
| US20130179314A1 (en) * | 2005-03-24 | 2013-07-11 | Accenture Global Services Limited | Risk Based Data Assessment |
| US8515774B2 (en) * | 2004-02-18 | 2013-08-20 | Siemens Aktiengesellschaft | Method and system for measuring quality of performance and/or compliance with protocol of a clinical study |
| US20130311196A1 (en) | 2012-05-18 | 2013-11-21 | Medtronic, Inc. | Establishing Risk-Based Study Conduct |
Family Cites Families (1)
| Publication number | Priority date | Publication date | Assignee | Title |
|---|---|---|---|---|
| CN1961321A (en) * | 2004-05-21 | 2007-05-09 | 西门子医疗健康服务公司 | Method and system for providing medical decision support |
-
2012
- 2012-11-16 US US13/679,533 patent/US8706537B1/en active Active
-
2013
- 2013-11-14 EP EP13855172.6A patent/EP2852923A4/en not_active Withdrawn
- 2013-11-14 WO PCT/US2013/070138 patent/WO2014078563A1/en active Application Filing
- 2013-11-14 KR KR1020157012745A patent/KR101781705B1/en active IP Right Grant
- 2013-11-14 CA CA2890822A patent/CA2890822C/en active Active
- 2013-11-14 CN CN201380059790.4A patent/CN104956380B/en active Active
Patent Citations (73)
| Publication number | Priority date | Publication date | Assignee | Title |
|---|---|---|---|---|
| US6496827B2 (en) | 1997-05-12 | 2002-12-17 | Mlk Software | Methods and apparatus for the centralized collection and validation of geographically distributed clinical study data with verification of input data to the distributed system |
| US7353238B1 (en) * | 1998-06-12 | 2008-04-01 | Outcome Sciences, Inc. | Apparatus and methods for determining and processing medical outcomes |
| US7251609B1 (en) * | 1999-04-29 | 2007-07-31 | The Trustees Of Boston University | Method for conducting clinical trials over the internet |
| US7054823B1 (en) * | 1999-09-10 | 2006-05-30 | Schering Corporation | Clinical trial management system |
| US6856973B1 (en) * | 1999-12-29 | 2005-02-15 | General Electric Capital Corporation | Methods and systems for assessing creditworthiness of a country |
| US6912502B1 (en) * | 1999-12-30 | 2005-06-28 | Genworth Financial, Inc., | System and method for compliance management |
| US7006992B1 (en) * | 2000-04-06 | 2006-02-28 | Union State Bank | Risk assessment and management system |
| US7386466B2 (en) * | 2000-05-17 | 2008-06-10 | Tvc International Inc. | Continuously updated data processing system and method for measuring and reporting on value creation performance that supports real-time benchmarking |
| US6353767B1 (en) * | 2000-08-25 | 2002-03-05 | General Electric Company | Method and system of confidence scoring |
| US20020078175A1 (en) * | 2000-12-15 | 2002-06-20 | Wallace Thomas Tracy | Scorecard wizard |
| US20020128861A1 (en) | 2001-01-05 | 2002-09-12 | Lau Lee Min | Mapping clinical data with a health data dictionary |
| US7415447B2 (en) * | 2001-04-02 | 2008-08-19 | Invivodata, Inc. | Apparatus and method for prediction and management of participant compliance in clinical research |
| US6879970B2 (en) * | 2001-04-02 | 2005-04-12 | Invivodata, Inc. | Apparatus and method for prediction and management of subject compliance in clinical research |
| US20030014287A1 (en) * | 2001-07-02 | 2003-01-16 | Dell Products, L.P. | Continuity of supply risk and cost management tool |
| US7359865B1 (en) * | 2001-11-05 | 2008-04-15 | I2 Technologies Us, Inc. | Generating a risk assessment regarding a software implementation project |
| US20050192963A1 (en) * | 2002-02-26 | 2005-09-01 | Tschiegg Mark A. | Risk management information interface system and associated methods |
| US7536405B2 (en) * | 2002-02-26 | 2009-05-19 | Global Asset Protection Services, Llc | Risk management information interface system and associated methods |
| US7441197B2 (en) * | 2002-02-26 | 2008-10-21 | Global Asset Protection Services, Llc | Risk management information interface system and associated methods |
| US7483917B2 (en) * | 2002-02-27 | 2009-01-27 | Industrial Interfaces Limited | Risk mapping system |
| US20040064341A1 (en) | 2002-09-27 | 2004-04-01 | Langan Pete F. | Systems and methods for healthcare risk solutions |
| US20040064346A1 (en) * | 2002-10-01 | 2004-04-01 | Reto Schneider | Method and system for gathering information relating to risks |
| US7711670B2 (en) * | 2002-11-13 | 2010-05-04 | Sap Ag | Agent engine |
| US7409357B2 (en) * | 2002-12-20 | 2008-08-05 | Accenture Global Services, Gmbh | Quantification of operational risks |
| US20040122756A1 (en) * | 2002-12-23 | 2004-06-24 | Creeden Denis Michael | Methods and systems for managing risk management information |
| US7213037B2 (en) * | 2003-01-13 | 2007-05-01 | I2 Technologies Us, Inc. | Master data management system for centrally managing cached data representing core enterprise reference data maintained as locked in true state read only access until completion of manipulation process |
| US20040210574A1 (en) * | 2003-04-01 | 2004-10-21 | Amanda Aponte | Supplier scorecard system |
| US7698148B2 (en) * | 2003-09-12 | 2010-04-13 | Raytheon Company | Web-based risk management tool and method |
| US7752057B2 (en) * | 2003-09-22 | 2010-07-06 | Medidata Solutions, Inc. | System and method for continuous data analysis of an ongoing clinical trial |
| US20050154628A1 (en) * | 2004-01-13 | 2005-07-14 | Illumen, Inc. | Automated management of business performance information |
| US20080077457A1 (en) * | 2004-02-03 | 2008-03-27 | Swiss Reinsurance Company | System and Method for Automated Risk Determination and/or Optimization of the Service Life of Technical Facilities |
| US8515774B2 (en) * | 2004-02-18 | 2013-08-20 | Siemens Aktiengesellschaft | Method and system for measuring quality of performance and/or compliance with protocol of a clinical study |
| US20070150313A1 (en) * | 2004-02-18 | 2007-06-28 | Klaus Abraham-Fuchs | Method for evaluating the quality of electronically stored, particularly medical, knowledge data |
| US20050182658A1 (en) * | 2004-02-18 | 2005-08-18 | Klaus Abraham-Fuchs | Method of improving a clinical study |
| US20050182663A1 (en) * | 2004-02-18 | 2005-08-18 | Klaus Abraham-Fuchs | Method of examining a plurality of sites for a clinical trial |
| US20050256380A1 (en) * | 2004-05-14 | 2005-11-17 | Accelere, Inc. | Patient recruitment method and system |
| US20060161456A1 (en) * | 2004-07-29 | 2006-07-20 | Global Managed Care Solutions, d/b/a Med-Vantage® , a corporation | Doctor performance evaluation tool for consumers |
| US20070061393A1 (en) * | 2005-02-01 | 2007-03-15 | Moore James F | Management of health care data |
| US20130179314A1 (en) * | 2005-03-24 | 2013-07-11 | Accenture Global Services Limited | Risk Based Data Assessment |
| US8086708B2 (en) * | 2005-06-07 | 2011-12-27 | International Business Machines Corporation | Automated and adaptive threshold setting |
| US20060287997A1 (en) | 2005-06-17 | 2006-12-21 | Sooji Lee Rugh | Pharmaceutical service selection using transparent data |
| US20070016542A1 (en) * | 2005-07-01 | 2007-01-18 | Matt Rosauer | Risk modeling system |
| US20110161245A1 (en) * | 2005-11-03 | 2011-06-30 | Equitynet, Llc | Electronic System for Analyzing the Risk of an Enterprise |
| US7937423B2 (en) * | 2005-11-23 | 2011-05-03 | Ultra-Scan Corporation | Systems and methods of conducting clinical research |
| US7853476B2 (en) * | 2006-01-30 | 2010-12-14 | Bruce Reiner | Method and apparatus for generating a clinician quality assurance scorecard |
| US7571109B2 (en) * | 2006-07-14 | 2009-08-04 | Fawls Robert A | System and method for assessing operational process risk and quality by calculating operational value at risk |
| US7644026B2 (en) * | 2006-10-25 | 2010-01-05 | Hewlett-Packard Development Company, L.P. | Ranking systems based on a risk |
| US20080140514A1 (en) * | 2006-12-11 | 2008-06-12 | Grant Thornton Llp | Method and system for risk evaluation and management |
| US20080154637A1 (en) | 2006-12-22 | 2008-06-26 | Capelli Christopher C | Methods for risk-adjusted performance analysis |
| US7606795B2 (en) * | 2007-02-08 | 2009-10-20 | International Business Machines Corporation | System and method for verifying the integrity and completeness of records |
| US20080270420A1 (en) | 2007-04-27 | 2008-10-30 | Rosenberg Michael J | Method and System for Verification of Source Data in Pharmaceutical Studies and Other Applications |
| US20080270181A1 (en) * | 2007-04-27 | 2008-10-30 | Rosenberg Michael J | Method and system for collection, validation, and reporting of data and meta-data in conducting adaptive clinical trials |
| US20080319726A1 (en) * | 2007-06-19 | 2008-12-25 | Schlumberger Technology Corporation | System and method for performing oilfield simulation operations |
| US8180710B2 (en) * | 2007-09-25 | 2012-05-15 | Strichman Adam J | System, method and computer program product for an interactive business services price determination and/or comparison model |
| US20090138306A1 (en) * | 2007-09-28 | 2009-05-28 | Johnson Controls Technology Company | Facility risk assessment systems and methods |
| US8140383B2 (en) * | 2007-12-17 | 2012-03-20 | Sap Ag | Derived and automated key performance indicator reports |
| US20090276259A1 (en) * | 2008-05-02 | 2009-11-05 | Karol Bliznak | Aggregating risk in an enterprise strategy and performance management system |
| US20100198630A1 (en) * | 2009-01-30 | 2010-08-05 | Bank Of America Corporation | Supplier risk evaluation |
| US8185430B2 (en) * | 2009-01-30 | 2012-05-22 | Bank Of America Corporation | Supplier stratification |
| US20100324936A1 (en) | 2009-04-22 | 2010-12-23 | Suresh-Kumar Venkata Vishnubhatla | Pharmacy management and administration with bedside real-time medical event data collection |
| US20120150570A1 (en) * | 2009-08-20 | 2012-06-14 | Ali Samad-Khan | Risk assessment/measurement system and risk-based decision analysis tool |
| US20110077958A1 (en) | 2009-09-24 | 2011-03-31 | Agneta Breitenstein | Systems and methods for clinical, operational, and financial benchmarking and comparative analytics |
| US20110191138A1 (en) * | 2010-02-01 | 2011-08-04 | Bank Of America Corporation | Risk scorecard |
| US20110313782A1 (en) * | 2010-06-16 | 2011-12-22 | Parexel International Corporation | Integrated clinical trial workflow system |
| US7921125B1 (en) * | 2010-07-20 | 2011-04-05 | Numoda Technologies, Inc. | Virtual data room with access to clinical trial status reports based on real-time clinical trial data |
| US20120053995A1 (en) * | 2010-08-31 | 2012-03-01 | D Albis John | Analyzing performance and setting strategic targets |
| US20120096005A1 (en) * | 2010-10-19 | 2012-04-19 | Innovo Commerce, LLC | System and method for remote source data verification |
| US20120226621A1 (en) * | 2011-03-03 | 2012-09-06 | Ecolab Usa Inc. | Modeling risk of foodborne illness outbreaks |
| US20120296695A1 (en) * | 2011-05-19 | 2012-11-22 | Aon Global Risk Research Limited | Risk Portal Including Index Tool |
| US20120323589A1 (en) * | 2011-06-17 | 2012-12-20 | Sanjay Udani | Methods and systems for assuring compliance |
| US20130013332A1 (en) | 2011-07-07 | 2013-01-10 | Georgetown University | System and method for performing pharmacovigilance |
| US20130060599A1 (en) * | 2011-09-01 | 2013-03-07 | Aon Consulting, Inc. | People Risk Portal |
| US8423388B1 (en) * | 2012-01-17 | 2013-04-16 | Aon Global Risk Research Limited | GUI for risk profiles |
| US20130311196A1 (en) | 2012-05-18 | 2013-11-21 | Medtronic, Inc. | Establishing Risk-Based Study Conduct |
Non-Patent Citations (70)
| Title |
|---|
| Baigent C. et al., Ensuring trial validity by data quality assurance and diversification of monitoring methods Clinical Trials, vol. 5, No. 1, 2008. * |
| Cleveland, David, Country Risk Maps Jun. 2007. * |
| Cochran, Crissy J. et al., Oversight of Clinical Investigations: A Risk-Based Approach to Monitoring (Draft Guidance) U.S. Food and Drug Administration, Oct. 2011. * |
| Cognizant's Clinical Transformation: More than a solution, It's a New Way to Work Cognizant, Jul. 2012. * |
| De, Sourabh, Hybrid approaches to clinical trial monitoring: Practical alternatives to 100% source data verification, Perspectives Clinical Research, vol. 2, No. 3, Jul.-Sep. 2011. * |
| Doffange, Erik, Implementation of Key Risk Indicators for a large scale trial PhUSE Single Day Events, Apr. 28, 2011. * |
| Dunham, Corey et al., Implementation of Adaptive Clinical Trials, an Aptiv Solutions White Paper, Mar. 14, 2012, Aptiv Solutions. |
| Elsa, Valdes-Marquez et al., A key risk indicator approach to central statistical monitoring in multicentre clinical trials: method development in the context of an ongoing large-scale randomized trial, Clinical Trials Methdology Conference, Oct. 2011. * |
| Ergometrics.com-web pages Ergometrics, Mar. 2000, Retrieved from Archive.org, Jan. 25, 2007. * |
| Ergometrics.com—web pages Ergometrics, Mar. 2000, Retrieved from Archive.org, Jan. 25, 2007. * |
| Getting the Pulse on the Industry: Soundbites from Medidata User Group, Geeks Talk Clinical Blog, May 18, 2012 (http://blog.mdsol.com/2012/05/18/getting-the-pulse-on-the-industry-soundbites-from-medidata-user-group/, last accessed on Nov. 14, 2012). |
| Green, Jeanne et al., MCC Update: Implementing Standardized Clinical Trial Performance Metrics to Manage Risk and Drive Quality in Clinical Trials, Metrics Champion Consortium, Third Annual Effective Business Development Outsourcing Relationships, Jul. 20, 2011. * |
| Guidance for Industry: E6 Good Clinical Practice: Consolidated Guidance, Apr. 1996, International Conference on Harmonisation of Technical Requirements for Registration of Pharmaceuticals for Human Use (ICH), U.S. Department of Health and Human Services, Food and Drug Administration, United States (http://www.fda.gov/downloads/Drugs/.../Guidances/ucm073122.pdf, last accessed on Nov. 16, 2012). |
| Guidance for Industry: Oversight of Clinical Investigations-A Risk-Based Approach to Monitoring (Draft Guidance), Aug. 24, 2011, U.S. Department of Health and Human Services, Food and Drug Administration, United States (http://www.fda.gov/downloads/Drugs/.../Guidances/UCM269919.pdf, last accessed on Nov. 16, 2012). |
| Guidance for Industry: Oversight of Clinical Investigations—A Risk-Based Approach to Monitoring (Draft Guidance), Aug. 24, 2011, U.S. Department of Health and Human Services, Food and Drug Administration, United States (http://www.fda.gov/downloads/Drugs/.../Guidances/UCM269919.pdf, last accessed on Nov. 16, 2012). |
| Halloran, Laurie & Young, Steve, New Approaches to Site Monitoring and Management, May 23, 2012. |
| Henderson, Lisa, Have Monitor, Will Travel?, Applied Clinical Trials Online, Jun. 8, 2010 (http://www.appliedclinicaltrialsonline.com/appliedclinicaltrials/News/Have-Monitor-Will-Travel/ArticleStandard/Article/detail/672687, last accessed on Nov. 14, 2012). |
| Highlights of the People Risk Index Ratings Aon Consulting, 2010. * |
| ICH Harmonised Tripartite Guideline-Statistical Principles for Clinical Trials E9, Current Step 4 version, Feb. 5, 1998, International Conference on Harmonisation of Technical Requirements for Registration of Pharmaceuticals for Human Use. |
| ICH Harmonised Tripartite Guideline—Statistical Principles for Clinical Trials E9, Current Step 4 version, Feb. 5, 1998, International Conference on Harmonisation of Technical Requirements for Registration of Pharmaceuticals for Human Use. |
| ICH Topic E6 (R1)-Guideline for Good Clinical Practice, Step 5, Note for Guidance on Good Clinical Practice (CPMP/ICH/135/95), Jul. 2002, European Medicines Agency, London, United Kingdom. |
| ICH Topic E6 (R1)—Guideline for Good Clinical Practice, Step 5, Note for Guidance on Good Clinical Practice (CPMP/ICH/135/95), Jul. 2002, European Medicines Agency, London, United Kingdom. |
| INC Research Leads the Way for Risk-Based Monitoring Using Medidata Targeted SDV Solution Medidata, Dec. 2012. * |
| Lawton, Andy et al., Risk Based Approach-Case Study FDA meeting Quality by Design, Aug. 2011. * |
| Lawton, Andy et al., Risk Based Approach—Case Study FDA meeting Quality by Design, Aug. 2011. * |
| Miller, George, Risk approach comes to site monitoring FierceBiotechIT, Aug. 30, 2010. * |
| Mundra, Ashwin & Young, Stephen, Are You Properly Equipped to Execute Risk-Based Site Monitoring?, PharmaVOICE, Nov. /Dec. 2010. |
| Nelson, Greg, Implementing Metrics Management for Improving Clinical Trials Performance BeyeNetwork, Jul. 17, 2008. * |
| Nordic Bioscience Targets 20% SDV with Risk-Based Monitoring to Streamline Clinical Trial Execution Medidata, Aug. 2012. * |
| Notes from presentation given by Stephen Young at Sapphire Now Conference, May 2011. |
| Petrarca, Mike, Ganguly, Shantanu, Ph.D.; & Young, Steve, How to be Confident Your Risk-Based Monitoring Program is Working, Sep. 26, 2013. |
| Risk-Adapted Monitoring in Clinical Tirals European Clinical Research Infrastracture Network, 2011. * |
| Risk-based Monitoring Strategies for Improved Clinical Trial Performance Cognizant, 2013. * |
| Tantsyura, Vadim et al., Risk-based Source Data Verification Approaches: Pros and Cons, Drug Information Journal, Nov. 8, 2010, vol. 44, pp. 745-756, Drug Information Association, Inc. |
| Tantsyura, Vadim, Who's Afraid of Risk-Based Monitoring?, Geeks Talk Clinical Blog, Sep. 21, 2012 (http://blog.mdsol.com/2012/09/21/whos-afraid-of-risk-based-monitoring/, last accessed on Nov. 16, 2012). |
| Venet, David et al., A statistical approach to central monitoring of data quality in clinical trials Clinical Trials, Jun. 8, 2012. * |
| Widler, Beat, Principles of Quality Risk Management-Session I: Principles for Building Quality into Clinical Trial Development, Aug. 2011. * |
| Widler, Beat, Principles of Quality Risk Management—Session I: Principles for Building Quality into Clinical Trial Development, Aug. 2011. * |
| Williams, G.W., The other side of clinical trial monitoring; assuring data quality and procedural adherence Clinical Trials, vol. 3, No. 6, 2006. * |
| Workshop on Quality Risk Management: Making Clinical Trials Fir for Purpose: Summar of Meeting held Aug. 23-24, 2011 Clinical Trials Transformation Initiative, Feb. 2012. * |
| Written opinion of the International Searching Authority, PCT/US2013/70138, Jan. 16, 2014. |
| Young, Stephen & Mundra, Ashwin, Data Quality Monitoring, European Pharmaceutical Contractor, Autumn 2010. |
| Young, Stephen, Adopting Site Quality Management to Optimize Risk-Based Monitoring, White Paper, Oct. 2012, Medidata Solutions, Inc. |
| Young, Stephen, Enable Risk-based Site Monitoring, Medidata Rave® Targeted SDV, Aug. 2011, Medidata Solutions, Inc. |
| Young, Stephen, INC Research Leads the Way for Risk-Based Monitoring Using Medidata Targeted SDV Solution, Case Study, Dec. 2012, Medidata Solutions, Inc. |
| Young, Stephen, Medidata Insights(TM) SQM Improve Site Quality With a Turnkey, Centralized Monitoring Solution, Nov. 2013, Medidata Solutions, Inc. |
| Young, Stephen, Medidata Insights™ SQM Improve Site Quality With a Turnkey, Centralized Monitoring Solution, Nov. 2013, Medidata Solutions, Inc. |
| Young, Stephen, Nordic Bioscience Targets 20% SDV with Risk-Based Monitoring to Streamline Clinical Trial Execution, Case Study, Aug. 2012, Medidata Solutions, Inc. |
| Young, Steve & Altman, Igor, Using the Medidata Clinical Cloud to Implement TransCelerate's Risk-Based Monitoring Methodology, Jul. 30, 2013. |
| Young, Steve & Given, Kyle, Risk-Based Monitoring: Implementation Success Stories, Oct. 9, 2013. |
| Young, Steve & Pines, Josh, Medidata Insights Product Webinar, Oct. 19, 2011. |
| Young, Steve, Best Practices for Centralized Site Quality Monitoring, Nov. 15, 2012. |
| Young, Steve, Centralized Site Quality Management-Best Practices & Implications for Data Management, SCDM 2013 Annual Conference, Sep. 10-13, 2013, Chicago, IL. |
| Young, Steve, Centralized Site Quality Management—Best Practices & Implications for Data Management, SCDM 2013 Annual Conference, Sep. 10-13, 2013, Chicago, IL. |
| Young, Steve, Enabling Targeted Monitoring with a Centralized Site Quality Management Program, Apr. 11, 2012. |
| Young, Steve, Leveraging Clinical Development Metrics-Focus on Site Quality, Apr. 26, 2012. |
| Young, Steve, Leveraging Clinical Development Metrics—Focus on Site Quality, Apr. 26, 2012. |
| Young, Steve, Medidata Case Study: The Key Initiatives of the Insights Council, PCT 2012, Nov. 7, 2012. |
| Young, Steve, Optimizing Monitoring Through Site Quality Management, 9th Annual Clinical Performance Metrics and Benchmarking Summit, Dec. 8, 2012, Philadelphia, PA. |
| Young, Steve, Risk-Based Monitoring: Right Sizing SDV Without Compromising Quality, ACRP 2013 Global Conference & Exhibition, Apr. 13, 2013, Orlando, FL. |
| Young, Steve, Risk-Based Site Monitoring & Data Management's Role, Sep. 2012. |
| Young, Steve, Site Quality Management and Risk-Based Monitoring-A New Approach, Nov. 12, 2012. |
| Young, Steve, Site Quality Management and Risk-Based Monitoring—A New Approach, Nov. 12, 2012. |
| Young, Steve, Site Quality Management-Product Preview, Jun. 6, 2012. |
| Young, Steve, Site Quality Management—Product Preview, Jun. 6, 2012. |
| Young, Steve, Solutions to Enable a Successful Risk-Based Monitoring Implementation, Oct. 24, 2013. |
| Young, Steve, Solutions to Enable and Optimize Strategic Monitoring, Sep. 25, 2013. |
| Young, Steve, Turning Clinical R&D Metrics and Analytics into Transformational Solutions, CORE 2012, Oct. 11, 2012. |
| Young, Steve, Using Analytics & Benchmarking to Optimize Targeted Site Monitoring, Dec. 9, 2011. |
| Young, Steve; Baur, Trent; & Pines, Josh, Medidata Insights Product Webinar, Jul. 21, 2011. |
Cited By (38)
| Publication number | Priority date | Publication date | Assignee | Title |
|---|---|---|---|---|
| US11392670B1 (en) * | 2011-12-09 | 2022-07-19 | Iqvia Inc. | Systems and methods for streaming normalized clinical trial capacity information |
| US20140236668A1 (en) * | 2012-11-16 | 2014-08-21 | Medidata Solutions, Inc. | Method and apparatus for remote site monitoring |
| US20140249835A1 (en) * | 2013-02-08 | 2014-09-04 | Parexel International Corporation | Methods and apparatus for data-driven monitoring |
| US11170875B2 (en) * | 2013-02-08 | 2021-11-09 | Pi Blocker Corporation | Methods and apparatus for data-driven monitoring |
| US11633533B2 (en) | 2013-03-14 | 2023-04-25 | Smith & Nephew, Inc. | Control architecture for reduced pressure wound therapy apparatus |
| US10905806B2 (en) | 2013-03-14 | 2021-02-02 | Smith & Nephew, Inc. | Reduced pressure wound therapy control and data communication |
| US10610624B2 (en) | 2013-03-14 | 2020-04-07 | Smith & Nephew, Inc. | Reduced pressure therapy blockage detection |
| US20140375650A1 (en) * | 2013-06-24 | 2014-12-25 | Quintiles Transnational Corporation | Systems and methods for data visualization |
| US20210374645A1 (en) * | 2013-06-28 | 2021-12-02 | Healthtap, Inc. | Systems and methods for improving communication efficiency and reducing data redundancy in a computerized platform |
| US20160275269A1 (en) * | 2015-03-20 | 2016-09-22 | International Drug Development Institute | Methods for central monitoring of research trials |
| US11017000B2 (en) | 2015-04-07 | 2021-05-25 | International Business Machines Corporation | Medical clinical trial site identification |
| US10515099B2 (en) | 2015-04-07 | 2019-12-24 | International Business Machines Corporation | Medical clinical trial site identification |
| US20180240553A1 (en) * | 2015-09-04 | 2018-08-23 | Remarque Systems, Inc. | Risk-Based Monitoring of Clinical Data |
| US11056239B2 (en) * | 2015-09-04 | 2021-07-06 | Remarque Systems, Inc. | Risk-based monitoring of clinical data |
| US11315681B2 (en) | 2015-10-07 | 2022-04-26 | Smith & Nephew, Inc. | Reduced pressure therapy device operation and authorization monitoring |
| US11783943B2 (en) | 2015-10-07 | 2023-10-10 | Smith & Nephew, Inc. | Reduced pressure therapy device operation and authorization monitoring |
| US20170103190A1 (en) * | 2015-10-09 | 2017-04-13 | Algorithm Inc | System and method for evaluating risks of clinical trial conducting sites |
| US10915849B2 (en) * | 2015-12-14 | 2021-02-09 | Carrier Corporation | Method and system for determining quality level of performance data associated with an enterprise |
| US20170169380A1 (en) * | 2015-12-14 | 2017-06-15 | Wipro Limited | Method and System for Determining Quality Level of Performance Data Associated With an Enterprise |
| CN107451709B (en) * | 2016-04-28 | 2023-08-08 | 霍尼韦尔国际公司 | System and method for displaying dynamic risk level indicators for remote monitoring sites on a map |
| CN107451709A (en) * | 2016-04-28 | 2017-12-08 | 霍尼韦尔国际公司 | The system and method that the dynamic risk level indicator of ATM websites or other remote monitoring websites is shown on map |
| EP3239915A1 (en) * | 2016-04-28 | 2017-11-01 | Honeywell International Inc. | Systems and methods for displaying a dynamic risk level indicator of an atm site or other remote monitoring site on a map for improved remote monitoring |
| US11602461B2 (en) | 2016-05-13 | 2023-03-14 | Smith & Nephew, Inc. | Automatic wound coupling detection in negative pressure wound therapy systems |
| US11369730B2 (en) | 2016-09-29 | 2022-06-28 | Smith & Nephew, Inc. | Construction and protection of components in negative pressure wound therapy systems |
| US10854319B2 (en) * | 2017-05-09 | 2020-12-01 | Analgesic Solutions Llc | Systems and methods for visualizing clinical trial site performance |
| US20200082920A1 (en) * | 2017-05-09 | 2020-03-12 | Analgesic Solutions | Systems and Methods for Visualizing Clinical Trial Site Performance |
| AU2018266817B2 (en) * | 2017-05-09 | 2022-05-19 | Analgesic Solutions | Systems and methods for visualizing clinical trial site performance |
| US11712508B2 (en) | 2017-07-10 | 2023-08-01 | Smith & Nephew, Inc. | Systems and methods for directly interacting with communications module of wound therapy apparatus |
| US11494680B2 (en) * | 2018-05-15 | 2022-11-08 | Medidata Solutions, Inc. | System and method for predicting subject enrollment |
| US11133101B2 (en) * | 2018-05-23 | 2021-09-28 | Tata Consultancy Services Limited | Method and system for data driven cognitive clinical trial feasibility program |
| US11610168B2 (en) * | 2018-12-17 | 2023-03-21 | Isd Inc. | Method for analyzing risk of cooperrator supply chain |
| US20210326784A1 (en) * | 2018-12-17 | 2021-10-21 | Isd Inc. | Method for analyzing risk of cooperrator supply chain |
| US11793924B2 (en) | 2018-12-19 | 2023-10-24 | T.J.Smith And Nephew, Limited | Systems and methods for delivering prescribed wound therapy |
| US11715054B1 (en) | 2019-12-11 | 2023-08-01 | Wells Fargo Bank, N.A. | Computer systems for meta-alert generation based on alert volumes |
| CN112785021A (en) * | 2021-01-28 | 2021-05-11 | 联仁健康医疗大数据科技股份有限公司 | Reservation request response method and device, electronic equipment and storage medium |
| US20220359048A1 (en) * | 2021-05-05 | 2022-11-10 | Iqvia Inc. | Ai and ml assisted system for determining site compliance using site visit report |
| US20230111459A1 (en) * | 2021-10-13 | 2023-04-13 | Johnson Controls Tyco IP Holdings LLP | Building system for building equipment with external model integration |
| US11961596B2 (en) | 2022-06-15 | 2024-04-16 | Iqvia Inc. | Systems and methods for streaming normalized clinical trial capacity information |
Also Published As
| Publication number | Publication date |
|---|---|
| CA2890822C (en) | 2016-11-01 |
| EP2852923A4 (en) | 2016-01-06 |
| CN104956380A (en) | 2015-09-30 |
| WO2014078563A1 (en) | 2014-05-22 |
| CN104956380B (en) | 2018-06-19 |
| KR20150084851A (en) | 2015-07-22 |
| EP2852923A1 (en) | 2015-04-01 |
| CA2890822A1 (en) | 2014-05-22 |
| KR101781705B1 (en) | 2017-09-25 |
Similar Documents
| Publication | Publication Date | Title |
|---|---|---|
| US8706537B1 (en) | Remote clinical study site monitoring and data quality scoring | |
| US20140236668A1 (en) | Method and apparatus for remote site monitoring | |
| US20210042678A1 (en) | Decision support system for hospital quality assessment | |
| Health Quality Ontario | Effect of early follow-up after hospital discharge on outcomes in patients with heart failure or chronic obstructive pulmonary disease: a systematic review | |
| Ferrier et al. | Incorporating quality into the measurement of hospital efficiency: a double DEA approach | |
| US11188865B2 (en) | Assisted analytics | |
| Woodall et al. | The use of control charts in healthcare | |
| CN112133388A (en) | Computer-implemented method and system | |
| US20150220868A1 (en) | Evaluating Data Quality of Clinical Trials | |
| Lin et al. | Impulse response function analysis of the impacts of hospital accreditations on hospital efficiency | |
| Nordo et al. | Evaluative Outcomes in Direct Extraction and Use of EHR Data in Clinical Trials. | |
| Kalvin et al. | Hospital-onset bacteremia and fungemia: an evaluation of predictors and feasibility of benchmarking comparing two risk-adjusted models among 267 hospitals | |
| US20170364646A1 (en) | Method and system for analyzing and displaying optimization of medical resource utilization | |
| US20190051411A1 (en) | Decision making platform | |
| Lloyd II et al. | THE USE OF SIX SIGMA IN HEALTH CARE OPERATIONS: APPLICATION AND OPPORTUNITY. | |
| Brown et al. | Benchmarking for small hospitals: size didn't matter! | |
| Riley et al. | Pediatric primary care psychologists’ reported level of integration, billing practices, and reimbursement frequency. | |
| Long et al. | A New Method for Database Data Quality Evaluation at the Canadian Institute for Health Information (CIHI). | |
| Indicators | Quality indicator measure development, implementation, maintenance, and retirement | |
| Labella et al. | Consistency of safety monitoring using routine national databases: results using a quality of care interpretative model | |
| Moran et al. | Comparing the performance of English mental health providers in achieving patient outcomes | |
| Dixon et al. | Why “what data are necessary for this project?” and other basic questions are important to address in public health informatics practice and research | |
| McKinley et al. | Impact of universal suicide risk screening in a pediatric emergency department: A discrete event simulation approach | |
| Nikolaeva et al. | Patient measurements simulation and event processing in telemedicine systems | |
| Tholandi et al. | Approaches to improve and adapt maternal mortality estimations in low‐and middle‐income countries: A scoping review |
Legal Events
| Date | Code | Title | Description |
|---|---|---|---|
| AS | Assignment |
Owner name: MEDIDATA SOLUTIONS, INC., NEW YORK Free format text: ASSIGNMENT OF ASSIGNORS INTEREST;ASSIGNORS:YOUNG, STEPHEN;MARINELLI, VINCENT;LAUDANOVIC, MLADEN;AND OTHERS;SIGNING DATES FROM 20121115 TO 20121116;REEL/FRAME:029315/0466 |
|
| STCF | Information on status: patent grant |
Free format text: PATENTED CASE |
|
| MAFP | Maintenance fee payment |
Free format text: PAYMENT OF MAINTENANCE FEE, 4TH YEAR, LARGE ENTITY (ORIGINAL EVENT CODE: M1551) Year of fee payment: 4 |
|
| AS | Assignment |
Owner name: HSBC BANK USA, NATIONAL ASSOCIATION, NEW YORK Free format text: SECURITY INTEREST;ASSIGNOR:MEDIDATA SOLUTIONS, INC.;REEL/FRAME:044979/0571 Effective date: 20171221 |
|
| AS | Assignment |
Owner name: CHITA INC., NEW YORK Free format text: RELEASE BY SECURED PARTY;ASSIGNOR:HSBC BANK USA;REEL/FRAME:050875/0776 Effective date: 20191028 Owner name: MEDIDATA SOLUTIONS, INC., NEW YORK Free format text: RELEASE BY SECURED PARTY;ASSIGNOR:HSBC BANK USA;REEL/FRAME:050875/0776 Effective date: 20191028 |
|
| MAFP | Maintenance fee payment |
Free format text: PAYMENT OF MAINTENANCE FEE, 8TH YEAR, LARGE ENTITY (ORIGINAL EVENT CODE: M1552); ENTITY STATUS OF PATENT OWNER: LARGE ENTITY Year of fee payment: 8 |