US8090747B2 - Method, system, computer-accessible medium and software arrangement for organization and analysis of multiple sets of data - Google Patents
Method, system, computer-accessible medium and software arrangement for organization and analysis of multiple sets of data Download PDFInfo
- Publication number
- US8090747B2 US8090747B2 US12/124,753 US12475308A US8090747B2 US 8090747 B2 US8090747 B2 US 8090747B2 US 12475308 A US12475308 A US 12475308A US 8090747 B2 US8090747 B2 US 8090747B2
- Authority
- US
- United States
- Prior art keywords
- data
- rule
- sets
- data structure
- candidates
- Prior art date
- Legal status (The legal status is an assumption and is not a legal conclusion. Google has not performed a legal analysis and makes no representation as to the accuracy of the status listed.)
- Expired - Fee Related, expires
Links
- 238000000034 method Methods 0.000 title claims abstract description 78
- 238000004458 analytical method Methods 0.000 title description 9
- 230000008520 organization Effects 0.000 title 1
- 230000000694 effects Effects 0.000 claims description 40
- 238000012545 processing Methods 0.000 claims description 32
- 238000012360 testing method Methods 0.000 claims description 19
- 210000002569 neuron Anatomy 0.000 claims description 16
- 230000002123 temporal effect Effects 0.000 claims description 15
- 230000014509 gene expression Effects 0.000 claims description 9
- 238000010304 firing Methods 0.000 claims description 8
- 238000002493 microarray Methods 0.000 claims description 6
- 230000001364 causal effect Effects 0.000 description 23
- 208000035126 Facies Diseases 0.000 description 17
- 238000002474 experimental method Methods 0.000 description 11
- 108090000623 proteins and genes Proteins 0.000 description 9
- 230000007704 transition Effects 0.000 description 9
- 238000010586 diagram Methods 0.000 description 8
- 230000006870 function Effects 0.000 description 6
- 108091035707 Consensus sequence Proteins 0.000 description 5
- 210000004027 cell Anatomy 0.000 description 5
- 230000000875 corresponding effect Effects 0.000 description 4
- 201000010099 disease Diseases 0.000 description 4
- 208000037265 diseases, disorders, signs and symptoms Diseases 0.000 description 4
- 230000001537 neural effect Effects 0.000 description 4
- 206010006187 Breast cancer Diseases 0.000 description 3
- 208000026310 Breast neoplasm Diseases 0.000 description 3
- 206010058467 Lung neoplasm malignant Diseases 0.000 description 3
- 230000022131 cell cycle Effects 0.000 description 3
- 238000004891 communication Methods 0.000 description 3
- 230000002596 correlated effect Effects 0.000 description 3
- 238000005516 engineering process Methods 0.000 description 3
- 238000009472 formulation Methods 0.000 description 3
- 230000006872 improvement Effects 0.000 description 3
- 238000003780 insertion Methods 0.000 description 3
- 230000037431 insertion Effects 0.000 description 3
- 230000003993 interaction Effects 0.000 description 3
- 201000005202 lung cancer Diseases 0.000 description 3
- 208000020816 lung neoplasm Diseases 0.000 description 3
- 239000000203 mixture Substances 0.000 description 3
- 238000005457 optimization Methods 0.000 description 3
- QURLONWWPWCPIC-UHFFFAOYSA-N 2-(2-aminoethoxy)ethanol;3,6-dichloro-2-methoxybenzoic acid Chemical compound NCCOCCO.COC1=C(Cl)C=CC(Cl)=C1C(O)=O QURLONWWPWCPIC-UHFFFAOYSA-N 0.000 description 2
- 238000012935 Averaging Methods 0.000 description 2
- 101100327311 Dictyostelium discoideum anapc6 gene Proteins 0.000 description 2
- 244000141359 Malus pumila Species 0.000 description 2
- 241000234295 Musa Species 0.000 description 2
- 101150037418 POG1 gene Proteins 0.000 description 2
- 101100029960 Saccharomyces cerevisiae (strain ATCC 204508 / S288c) PLM2 gene Proteins 0.000 description 2
- 101100476580 Saccharomyces cerevisiae (strain ATCC 204508 / S288c) SAP185 gene Proteins 0.000 description 2
- 235000021016 apples Nutrition 0.000 description 2
- 235000021015 bananas Nutrition 0.000 description 2
- 230000008901 benefit Effects 0.000 description 2
- 230000008859 change Effects 0.000 description 2
- 238000003745 diagnosis Methods 0.000 description 2
- 230000002068 genetic effect Effects 0.000 description 2
- 238000012986 modification Methods 0.000 description 2
- 230000004048 modification Effects 0.000 description 2
- 230000007935 neutral effect Effects 0.000 description 2
- 230000008569 process Effects 0.000 description 2
- 230000004044 response Effects 0.000 description 2
- 230000000391 smoking effect Effects 0.000 description 2
- 230000001960 triggered effect Effects 0.000 description 2
- 230000000007 visual effect Effects 0.000 description 2
- 206010008874 Chronic Fatigue Syndrome Diseases 0.000 description 1
- 206010061818 Disease progression Diseases 0.000 description 1
- 206010028980 Neoplasm Diseases 0.000 description 1
- 206010060862 Prostate cancer Diseases 0.000 description 1
- 208000000236 Prostatic Neoplasms Diseases 0.000 description 1
- 238000007792 addition Methods 0.000 description 1
- 230000004075 alteration Effects 0.000 description 1
- 230000006399 behavior Effects 0.000 description 1
- 239000003795 chemical substances by application Substances 0.000 description 1
- 235000021443 coca cola Nutrition 0.000 description 1
- 238000007796 conventional method Methods 0.000 description 1
- 238000013479 data entry Methods 0.000 description 1
- 238000007418 data mining Methods 0.000 description 1
- 238000012350 deep sequencing Methods 0.000 description 1
- 238000011161 development Methods 0.000 description 1
- 230000018109 developmental process Effects 0.000 description 1
- 230000005750 disease progression Effects 0.000 description 1
- 239000003814 drug Substances 0.000 description 1
- 229940079593 drug Drugs 0.000 description 1
- 238000000605 extraction Methods 0.000 description 1
- 238000002372 labelling Methods 0.000 description 1
- 239000011159 matrix material Substances 0.000 description 1
- 230000005055 memory storage Effects 0.000 description 1
- 238000005065 mining Methods 0.000 description 1
- 208000029766 myalgic encephalomeyelitis/chronic fatigue syndrome Diseases 0.000 description 1
- 230000003287 optical effect Effects 0.000 description 1
- 238000011002 quantification Methods 0.000 description 1
- 238000002407 reforming Methods 0.000 description 1
- 230000001105 regulatory effect Effects 0.000 description 1
- 238000011160 research Methods 0.000 description 1
- 230000011218 segmentation Effects 0.000 description 1
- 238000002864 sequence alignment Methods 0.000 description 1
- 239000000779 smoke Substances 0.000 description 1
- 238000010186 staining Methods 0.000 description 1
- 238000007619 statistical method Methods 0.000 description 1
Images


Classifications
-
- G—PHYSICS
- G16—INFORMATION AND COMMUNICATION TECHNOLOGY [ICT] SPECIALLY ADAPTED FOR SPECIFIC APPLICATION FIELDS
- G16B—BIOINFORMATICS, i.e. INFORMATION AND COMMUNICATION TECHNOLOGY [ICT] SPECIALLY ADAPTED FOR GENETIC OR PROTEIN-RELATED DATA PROCESSING IN COMPUTATIONAL MOLECULAR BIOLOGY
- G16B40/00—ICT specially adapted for biostatistics; ICT specially adapted for bioinformatics-related machine learning or data mining, e.g. knowledge discovery or pattern finding
-
- G—PHYSICS
- G16—INFORMATION AND COMMUNICATION TECHNOLOGY [ICT] SPECIALLY ADAPTED FOR SPECIFIC APPLICATION FIELDS
- G16B—BIOINFORMATICS, i.e. INFORMATION AND COMMUNICATION TECHNOLOGY [ICT] SPECIALLY ADAPTED FOR GENETIC OR PROTEIN-RELATED DATA PROCESSING IN COMPUTATIONAL MOLECULAR BIOLOGY
- G16B30/00—ICT specially adapted for sequence analysis involving nucleotides or amino acids
- G16B30/10—Sequence alignment; Homology search
-
- G—PHYSICS
- G16—INFORMATION AND COMMUNICATION TECHNOLOGY [ICT] SPECIALLY ADAPTED FOR SPECIFIC APPLICATION FIELDS
- G16B—BIOINFORMATICS, i.e. INFORMATION AND COMMUNICATION TECHNOLOGY [ICT] SPECIALLY ADAPTED FOR GENETIC OR PROTEIN-RELATED DATA PROCESSING IN COMPUTATIONAL MOLECULAR BIOLOGY
- G16B30/00—ICT specially adapted for sequence analysis involving nucleotides or amino acids
-
- G—PHYSICS
- G16—INFORMATION AND COMMUNICATION TECHNOLOGY [ICT] SPECIALLY ADAPTED FOR SPECIFIC APPLICATION FIELDS
- G16B—BIOINFORMATICS, i.e. INFORMATION AND COMMUNICATION TECHNOLOGY [ICT] SPECIALLY ADAPTED FOR GENETIC OR PROTEIN-RELATED DATA PROCESSING IN COMPUTATIONAL MOLECULAR BIOLOGY
- G16B45/00—ICT specially adapted for bioinformatics-related data visualisation, e.g. displaying of maps or networks
-
- Y—GENERAL TAGGING OF NEW TECHNOLOGICAL DEVELOPMENTS; GENERAL TAGGING OF CROSS-SECTIONAL TECHNOLOGIES SPANNING OVER SEVERAL SECTIONS OF THE IPC; TECHNICAL SUBJECTS COVERED BY FORMER USPC CROSS-REFERENCE ART COLLECTIONS [XRACs] AND DIGESTS
- Y10—TECHNICAL SUBJECTS COVERED BY FORMER USPC
- Y10S—TECHNICAL SUBJECTS COVERED BY FORMER USPC CROSS-REFERENCE ART COLLECTIONS [XRACs] AND DIGESTS
- Y10S707/00—Data processing: database and file management or data structures
- Y10S707/912—Applications of a database
- Y10S707/941—Human sciences
-
- Y—GENERAL TAGGING OF NEW TECHNOLOGICAL DEVELOPMENTS; GENERAL TAGGING OF CROSS-SECTIONAL TECHNOLOGIES SPANNING OVER SEVERAL SECTIONS OF THE IPC; TECHNICAL SUBJECTS COVERED BY FORMER USPC CROSS-REFERENCE ART COLLECTIONS [XRACs] AND DIGESTS
- Y10—TECHNICAL SUBJECTS COVERED BY FORMER USPC
- Y10S—TECHNICAL SUBJECTS COVERED BY FORMER USPC CROSS-REFERENCE ART COLLECTIONS [XRACs] AND DIGESTS
- Y10S707/00—Data processing: database and file management or data structures
- Y10S707/912—Applications of a database
- Y10S707/944—Business related
-
- Y—GENERAL TAGGING OF NEW TECHNOLOGICAL DEVELOPMENTS; GENERAL TAGGING OF CROSS-SECTIONAL TECHNOLOGIES SPANNING OVER SEVERAL SECTIONS OF THE IPC; TECHNICAL SUBJECTS COVERED BY FORMER USPC CROSS-REFERENCE ART COLLECTIONS [XRACs] AND DIGESTS
- Y10—TECHNICAL SUBJECTS COVERED BY FORMER USPC
- Y10S—TECHNICAL SUBJECTS COVERED BY FORMER USPC CROSS-REFERENCE ART COLLECTIONS [XRACs] AND DIGESTS
- Y10S707/00—Data processing: database and file management or data structures
- Y10S707/912—Applications of a database
- Y10S707/95—Financial
Definitions
- the present invention relates to methods, system, computer-accessible medium and software arrangements for comparing two or more sets of data obtained as a function of, e.g., time, drug dose, gene expression, news releases, etc.
- data include, but are not limited to, biological experiments which may be exemplified by time course gene-expression or proteomic data.
- Exemplary embodiments of the present invention may build upon comparison techniques to organize a large number of sets of data (for example, data derived from experiments) in a database, and may support queries that may identify a dataset that supports or refutes a hypothesis.
- Applications of exemplary embodiments of the present invention may include, but are not limited to, biological experiments, neural spike-train data, disease progression data, variations in click-stream data for a group of sites on the internet, and/or financial data.
- the data may also include an ontological component, or other side information.
- data which includes a time-based series of job approval ratings may be combined with speech keywords over time. Rules governing the interactions between different types of time series may also be compared and developed.
- Exemplary embodiments of the present invention may be applied to various data streams that support numerical or logical data which may be queried with respect to set-membership questions.
- a CL-GoDB system was developed as an interface for the Gene Ontology (GO) database and provided a library of functions for manipulating GO.
- CL-GoDB has been integrated into GOALIE (a bioinformatics software package developed at NYU), which may be used for the study of time course microarray experiments.
- GOALIE in its original incarnation, may analyze time course data and search for a Hidden Kripke Model (“HKM”) using a temporal segmentation technique (e.g., one based on information bottleneck based optimization), and may mine the HKM to extract important invariants underlying the experimental data.
- the HKM may relate to hidden states or possible worlds, transitions among the states, and propositions that label the states.
- GOALIE may also structure information inherent to HKMs in a Gantt chart format and may provide a visual interface. For example, HKMs or Gantt charts corresponding to, e.g., two related experiments may be compared to discover how their components relate to one another. By comparing Gantt charts using sequence alignment tools, it may be possible to detect aspects of similarity between the two data sets, and hence how “nearby” they are with respect to each other or, e.g., to some other “idealized” experiment. Such distances may also suggest a structure among the datasets (such as a phylogenetic structure) that may be exploited by reflecting it in the structure of the database.
- Exemplary embodiments of the present invention relate generally to methods, computer-accessible medium, and systems for organizing and analyzing multiple sets of data.
- a computational device may be interpreted as a main-frame, desktop, laptop, pda (personalized digital assistant), cell phone, or other similar devices capable of combining and analyzing data
- a computer-accessible medium may be interpreted as any medium built upon such devices.
- described herein are computer-accessible medium having stored thereon computer executable instructions for organizing and analyzing at least two sets of input data.
- such instructions configure the processing arrangement to create a data structure for the at least two sets of input data; and compare the data structure for the at least two sets of input data, wherein said comparing sets results in organizing and analyzing the at least two sets of input data.
- Described herein are also exemplary embodiments of methods, systems and computer-accessible medium for organizing and analyzing at least two sets of input data, by possibly creating a data structure for the at least two sets of input data; and comparing the data structure for the at least two sets of input data.
- the comparing sets can result in organizing and analyzing the at least two sets of input data.
- a processing arrangement may be provided which, when executed, is configured to create a data structure for the at least two sets of input data; and compare the data structure for the at least two sets of input data, wherein said comparing sets results in organizing and analyzing the at least two sets of input data.
- FIG. 1 is an exemplary flow diagram illustrating analysis of stock market data in a system described herein. As exemplified in FIG. 1 , the system may be accessed by multiple users;
- FIG. 2 is a flow diagram illustrating a process of inserting input data into a database as described herein. Also shown in FIG. 2 is an exemplary comparison procedure as described herein;
- FIG. 3 is a flowchart exemplifying a comparison procedure as described herein;
- FIG. 4 is an exemplary data structure resulting from analysis of a dataset based on the Standard and Poors 500 stock index during the month of July using a system as described herein;
- FIG. 5 is a time-based plot of exemplary input data in the form of stock data
- FIG. 6 is a time-based plot of exemplary input data in the form of stock data
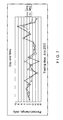
- FIG. 7 is a time-based plot of exemplary input data in the form of stock data
- FIG. 8 is an exemplary embodiment of a database structure for finance data
- FIG. 9 is an exemplary embodiment of a database structure for medical data
- FIG. 10 is an exemplary computer code listing for a procedure for comparing and/or aligning data representations, e.g., Gantt charts;
- FIG. 11 is an exemplary inferred causal structure with arrows denoting genuine causal inferences
- FIG. 12 is an exemplary inferred causal structure with arrows denoting genuine causal inferences.
- FIG. 13 is a combination of a system diagram and a further flow diagram in accordance with another exemplary embodiment of the present invention.
- Exemplary embodiments of the present invention may organize large amounts of data, where exact relations among these sets of data may not be completely known a priori.
- the data may be generated, for example, from a plurality of experiments which may be related experiments. Comparisons among the sets of data, which may further include a control and/or test data set, may be performed, e.g., using an alignment of their corresponding Gantt charts.
- genes expression microarray data may provide two types of information: numerical values of the gene expression levels, and names of the genes together with the terms they are annotated with in a controlled vocabulary such as the Gene Ontology.
- Stock market data may provide similar information, for example, on the up or down movements of the price for a stock each day (or on a finer timescale) as well as a categorization (such as technology, energy, etc).
- the inferences made in each case may be similar, even when the knowledge bases are unrelated.
- a biological setting e.g., when dealing with gene expression data, such comparison may be accomplished in two procedures: summarizing activity of Gene Otology (“GO”) terms over time windows (to create the Gantt charts—e.g., bar graphs representing the data over time); and aligning sequences of activity between pairs of experiments.
- GO Gene Otology
- Database structures used in accordance with exemplary embodiments of the present invention may exploit abstractions available based on raw data and ontological annotations. Further annotations of the data may also be made. For example, exemplary embodiments of the present invention may be used to correlate time series stock market data with time series news data (such as, e.g., news keywords, blog tags, and/or web search keywords), or gene expression data may be correlated with disease diagnoses. Further, an individual data set may be defined by multiple separate time series. For example, financial data may include time series information on, e.g., price changes as well as trading volume.
- the present invention is referred to as CLARITY, an abbreviation for Common Lisp data Alignment ReposITorY.
- the components of the present invention include, but are not limited to:
- one or more users may provide or upload input data, e.g., data sets, and optionally fill out a form containing information about the input data via, e.g., a simple form or series of checkboxes.
- the input data may be inserted into a database and placed into a data structure which acts as a repository for the input data, e.g., multiple data sets.
- the data structure of this repository may be, e.g., a phylogenetic-type tree, including all data sets or experimental conditions to be analyzed.
- Alternate data structure, (e.g., representations of the data) may be possible including, e.g., any network structure, graph, cladogram, etc.
- the lengths of edges in a phylogenetic-type tree may represent a distance of nodes from one another.
- specific breast cancer cell lines may be organized as a subset of breast cancer and then of all cancers.
- distance in the tree between such cell lines may be less than a distance between breast cancer cell lines and prostate cancer cell lines.
- the tree may be re-optimized (e.g., emptied and rebuilt) at certain intervals, e.g., after a predetermined number (such as 100 or 500) of inserts.
- the representation of the data may be thought of as continually learning and re-grouping data, such as patient-specific data, but each individual insert into it may remain fast.
- the data base is a repository for both the input data and representations of the data.
- One exemplary comparison technique may be based on Gantt charts, which may provide an overview of an entry's activity over a window of time.
- each bar in a Gantt chart of stock market data may represent a stock's activity (e.g., whether it traded up or down) over the period of, for example, a week.
- an exemplary comparison score for, e.g., produce a measure of similarity across, datasets.
- an overall similarity score may be assigned to a pair of datasets.
- this technique for multiple datasets and creating a tree based on the results may allow a quantification of how far apart certain data sets, e.g., illnesses, stocks, or other types of information, are from one another.
- Such exemplary comparison techniques may provide an annotated database, where it may further be possible to make queries and inferences.
- queries may be of the following type, “Display all highly active genes in white women over 45 who have chronic fatigue syndrome (CFS,) or “Display the most common categorization for stocks behaving similarly to the one the user has just specified.” Operations such as diagnosing patients based on their microarray data may then be possible.
- Providing a tunable value that represents the confidence in a categorization may allow certain invariants to be inferred such as, e.g., “You entered a patient who you believe has A, but their genes are behaving like that of a person with B, so treat them with C, since that cured B,” or “You were very confident in the diagnosis of the patient you entered; due to that confidence, we believe 10 other people in the database, entered with no diagnosis, have the same illness.”
- Such implementation may also be used to assign, for example, more or less weight to industry sector information when comparing stock price data.
- Data rows for biological data may be of the form, for example: “cell cycle,” ⁇ 1.3, cdc16 SAP185, 2, PLM2 POG1; where “cell cycle” may be an identifier, ⁇ 1.3 and 2 are numerical values which may describe, e.g., activity of the identifier during the 1 st and 2 nd windows respectively, and cdc16 and SAP185 may annotate “cell cycle” during window 1 and PLM2 and POG1 during window 2 .
- Gantt charts are data structures which may be employed in exemplary embodiments of the present invention.
- the data may be structured such that it may be broken into rows of discrete items, where the items may have a form such that there is a unique identification of the item, a series of columns including numerical components of the item, and optional further information such as, e.g., categorization, in the following columns.
- the numerical components may be arranged into overlapping “windows,” such that, for example, if the data ranges from time i to time j there may be windows of size 2 having the form i to i+3, i+3 to i+5 . . . j ⁇ 2 to j.
- the windows may be of any appropriate size; the value of 2 is used only for illustration.
- the windows need not be delineated in a physical representation of the data, as they may be a logical formulation imposed on the data later for simplification.
- a Gantt chart may be created by the following exemplary operations:
- Two primary data structures may be used to store the aligned items.
- One exemplary structure may contain a reference to the stored set of data or experiment and may have three slots: one for a Unique ID, one for a string describing the item's activity, and one for numerical data.
- the second data structure may contain a slot to hold a reference to an object of the type described above, as well as a slot for a score of the alignment. This second structure may be inserted into a hash table during alignment.
- the data may be compared to other such data items. Comparing a pair of data items may include, e.g., iterating over an intersection of the data items contained in each data set. In the case of microarray gene expression data, this may be performed by iterating over the terms annotating the genes in the dataset.
- the describing string for each term in this intersection may then be aligned using an exemplary procedure such as (e.g., a standard pairwise alignment procedure as described), (e.g., by Needleman and Wunsch), to provide a comparison score.
- FIG. 10 An exemplary procedure which may be used in exemplary embodiments of the present invention is shown in FIG. 10 .
- the scoring matrix used for this comparison may be altered depending on the type of data used.
- the score (e.g., similarity) between pairs of data may depend, in addition to an alignment score on other factors.
- 2+ ⁇ *Jaccard(GenesX, GenesY), where Jaccard(A,B) Intersection(A,B)/Union(A,B).
- Parameters ⁇ and ⁇ having values of zero, for example, may correspond to only the alignment score being considered. Increasing these values may assign an increasing weight to the difference in exact numerical values and genes regulating the terms. In biological and non-biological examples, for example, gene data may be replaced with any other data sets to be analyzed.
- An additional feature to a standard exemplary procedure for scoring an alignment may be inclusion of a measure of how much the items differ (e.g., a representation of an exact numerical distance), which may be weighted such that this measure may influence the results to a varying degree.
- a measure of how much the items differ e.g., a representation of an exact numerical distance
- the data may preferably be represented by letters U, D, N and I, which may represent up, down, neutral/normal and inactive, respectively.
- each term may then be stored in a hash table, with the hash key corresponding to a score associated with the pair of characters.
- This temporary data structure may facilitate sorting and/or manipulation of the intermediate alignments.
- the resulting alignments of terms may be compiled into a single alignment. This may be achieved, e.g., by averaging the scores of the individual alignments to form a single score for the data pair.
- a tree representing the relationships between the input data entries in the database may be a binary tree in which the entries are leaves and their relationships are represented by the internal nodes of the tree as well as its edges.
- the internal nodes may contain consensus sequences, which may be the statistically most correlated portions of their immediate descendants. They may also be defined by the exactly equivalent portions of the two children of the consensus node.
- the lengths of the edges of the tree may indicate the distance between nodes and their parents.
- Insertion of the data item into the database may involve a standard database insert as well as determining an entry's relationship to other current database members. This may be performed, e.g., by using a pre-order traversal of the phylogenetic tree, which may be binary, and determining at each step whether the entry to be inserted is more similar to the left or right child of the current node, where such similarity may be based on alignment of the entry to the consensus sequence or describing string at the node. This exemplary technique may be further improved by using a procedure that includes deeper nodes in the decision to move left or right.
- the entry to be inserted may be aligned to all descendants of the left/right children of the current node to a depth of k and may move left or right depending on the maximum similarity score.
- Such techniques are illustrated, e.g., in FIGS. 2 and 3 .
- the data structure (e.g., phylogenetic tree) may be reformed. Reforming may include, e.g., removal of all nodes and redetermination of the tree from the beginning. This may be done, e.g., using procedures such as neighbor joining.
- Exemplary Substructures within Data Structures may be analyzed. For example, within a main phylogenetic tree, it may be useful to break up the whole tree into smaller subtrees. This exemplary technique may be used to identify, e.g., subtypes of a disease, groups of similarly behaving stocks, and/or blogs discussing similar topics.
- One method of identifying such subtrees may be based on, e.g., three parameters such as: minimum tree size, maximum tree size, and a threshold for a minimum similarity score at the subtree's root. For example, a very large subtree may not be very informative, as there may be more variation between its members, but a tiny subtree with only a few nodes may also not provide much information.
- a subtree may include smaller sub-trees (perhaps including those that violate size requirements), and further requirements may be imposed on the subtrees including, e.g., a limitation that all consensus nodes in subtrees have a minimum score.
- FIG. 1 shows a flow diagram of an exemplary embodiment of a method for organizing or analyzing multiple sets of data, e.g., stock data according to the present invention.
- This exemplary method may be performed by a processing arrangement, for example, but not limited to, a computer that includes a microprocessor or another processing device, and using instructions stored on a computer-accessible medium (RAM, ROM, hard drive, or other storage device).
- the processing arrangement can receive data for Stock X over a period of 1.5 years 110 , which may be input into a database by a first user, e.g., User A. User A may optionally provide further information about Stock X in step 120 .
- step 130 the data for Stock X is inserted into a data structure, e.g., a phylogenetic-type tree structure, containing all stock data within the database.
- the tree may be displayed for User A, such display providing User A with a visual analysis as to how Stock X compares to the rest of the stock data (e.g., the market).
- a second user e.g., User B may connect to the database, e.g., through either the same or another processing arrangement.
- step 160 User B may query the phylogenetic-type tree to find that Stock Y is strongly correlated with Stock X.
- step 170 User B may study Stock X to find out more about Stock Y.
- a user may choose to insert Stock X into a database in step 200 , via, e.g., the processing arrangement.
- the data for Stock X may be structured in the form of a Gantt chart.
- the Gantt chart may be stored, e.g., in the same database, as a collection of data objects.
- Stock X is aligned to nodes in a phylogenetic-type tree in order to determine where it should be inserted in the phylogenetic-type tree.
- the data for Stock X is inserted and the neighboring consensus sequences and nodes are updated to maintain the binary structure and accuracy.
- FIG. 3 which shows a flow diagram of yet another exemplary embodiment of the method according to the present invention
- an exemplary procedure or method for alignment is illustrated.
- Stock X in Gantt chart format is input into a database.
- step 310 a pairwise alignment of Stock X with a current node, N's, left and right children is performed.
- Step 310 is performed for each node in a phylogenetic-type tree until the similarity score is no longer improved by such comparison.
- step 320 the alignment of each item common to Stock X and other nodes is hashed using the alignment score as a key, and in step 330 , a single score representing the alignment of Stock X and N is returned along with a consensus sequence.
- step 340 the maximum score between two nodes is determined.
- the maximum score and the corresponding consensus sequence is returned.
- step 350 it is determined whether the score is an improvement. If that is the case, the node providing the maximum score becomes N in step 360 . Additionally, steps 310 - 360 are repeated until the score is no longer an improvement. If the score is not an improvement, the data for Stock X is inserted as a sibling of Node N in step 370 .
- the processing arrangement described herein above which is configured to execute one of more of the exemplary procedures and/or method shown in FIGS. 1-3 may be provided with an input arrangement, which may include, e.g., a wired network, a wireless network, the internet, an intranet, etc.
- the processing arrangement may be provided with an output arrangement, which may include, e.g., a wired network, a wireless network, the internet, an intranet, etc.
- FIG. 13 shows a diagram of a further exemplary embodiment of a combination of a method and a system for organizing or analyzing multiple sets of data according to the present invention.
- the exemplary method may be performed by the exemplary system which can include a processing arrangement 1300 such as, but not limited to, a computer with a microprocessor or another processing device, and can be used with instructions provided on a computer accessible medium.
- the processing arrangement can receive a first set of data 1310 and a second set of data 1320 .
- the processing arrangement generate a data structure for the first and second sets of data.
- the processing arrangement can determine whether all datasets have been compared. If not, another dataset may be compared to the data structure in step 1355 . If all datasets have been compared, the exemplary method stops in step 1400 .
- the processing arrangement 1300 may be provided with and/or include an input arrangement 1305 , which may include a communication network, e.g., a wired network, a wireless network, the internet, an intranet, etc.
- the processing arrangement 1300 may be provided with an output arrangement 1410 which may include, e.g., a wired network, a wireless network, the Internet, an intranet, etc.
- An exemplary embodiment described herein may also include generating rules.
- An association rule e.g., for shopping transaction data may be “20% of transactions that contain apples also contain bananas,” where 20% may be referred to as a confidence in the rule, and the percentage of all transactions containing both apples and bananas would be the support for the rule.
- One solution which may be introduced is the Apriori procedure, which involves finding events occurring either simultaneously or in a related way, with certain rules determining this relatedness. This type of pattern finding may be used for mining associations and sequential patterns.
- An event sequence may refer to, e.g., a series of (label, time) pairs, where the event labels may be obtained from some finite alphabet describing types of events.
- An episode may refer to a group of events occurring together. This may indicate either that they occur simultaneously (as in parallel episodes), or that they form a serial or an even more complex pattern.
- there may be two event sequences, but rules may be limited to a small subset of all possible rules, as described herein below.
- a common feature of such techniques may be that in order for a pattern of length n+1 to be frequent, its sub-pattern of length n must also be frequent.
- the number of patterns to be tested may be reduced in later stages of the procedure, and the representation of the data may also be simplified as each iteration rules out more patterns.
- the patterns of length n+1 being tested may be referred to as candidates, as these patterns may turn out to be frequent, but at this earlier stage of the analysis they may be treated as hypotheses.
- rules may have two components: a hypothesis A->B (e.g., if A then B), and the evidence A, and B.
- rules may have the structure A->B but they may also grow to rules such as A->(B ⁇ C) (if A then B and C) or any other desired temporal formula.
- A->B e.g., if A then B
- rules may have the structure A->B but they may also grow to rules such as A->(B ⁇ C) (if A then B and C) or any other desired temporal formula.
- a time series of market data may be extracted, as well as time series news data and test rules of the form “If news event A, then stock B has response C” where C may include, for example, that the price goes up or down or may take on a certain predicted numerical value.
- posterior odds of the rules being tested may be computed. This may provide an estimate of how well one event may be predicted after occurrence of another event.
- Such techniques may be used for, e.g., finding patterns in news stories and the response of the financial markets, finding connectedness among neurons from neural spike-train data, or correlating presidential speeches with job approval ratings. or other devices (e.g., mobile phone, personal digital assistant, etc.) with embedded computational modules etc.
- a simple exemplary rule generation procedure may include determining rules with one left side and one right side, where the left side may be used, e.g., to predict an event and the right side may be, e.g., the event being predicted.
- This type of formulation may be applied, for example, to correlating news keywords with stock price changes.
- An example of such a rule generation procedure is:
- h For each h in the set of hypotheses H, add h to candidates (a hypothesis may be a firing neuron, a keyword, or an ontology term);
- rule's odds are greater than the threshold, add it to the set of rules
- Another exemplary embodiment of the rule generation procedure can solve the problem formalized as follows: given a set of numerical time series data representing events for which it may be hypothesized that there may exist a causal structure, underlying relationships forming this structure may be inferred. A relationship between two events means that knowing one allows the explanation or prediction of the other. These inferred relationships may be of the form “c causes e within time t with probability p” where c is a logical rule, e is an atomic proposition and t is a window of time.
- causality rules may be formulas for causal relationships.
- Such causality rules are non-deterministic and are defined in terms of probabilities, where cause and effect are events. Two assumptions may be made. For example, it may be stipulated that causes are temporally prior to their effects. This assumption may be limiting in some ways, but it is may be justified by its relevance and its ability to significantly aid the inference process. Further, causes may raise the probabilities of their effects and describe how they may be inferred.
- causal rules may be represented in a probabilistic extension of CTL (Computation Tree Logic), PCTL.
- causal rules may use a logic such as UTSL (Unified Temporal Stochastic Logic), which incorporates statistical hypothesis testing, which may be extended for multiple hypothesis testing.
- Input may be represented data as follows. First, a finite set of atomic propositions, A, each denoting an event in the dataset is obtained. Rules may be comprised of atomic propositions a in the universe A, propositional logical connectives (such as , ⁇ , ) and modal operators denoting time and probability.
- path formulas and state formulas which may be defined inductively as:
- Each atomic proposition is a state formula
- Standard path quantifiers A (“for all paths”) and E (“for some future path”) and temporal operators F (“eventually holds”), G (“holds for entire future path”), U (“for two properties, p holds until q holds”, and q holds at some point), W (weak until or unless “p holds until q holds” but with no guarantee that q will ever hold), and X (“at the next state”) may be used.
- a “leads to” operator may be used.
- a leads-to operator may be defined as: f 1 ⁇ p ⁇ t f2 ⁇ AG [(f1 ⁇ F ⁇ p ⁇ t f2)] (1)
- Possible transitions from each state to each other state may be updated to reflect actual transitions and probabilities from the given input data.
- Exemplary causal relationships may be defined in terms of the time that elapses between cause and effect. If c occurs at time t and e occurs at time t′, the relationship may be characterized by the time that elapses between them, [t′ ⁇ t]. That is, if a hypothesis is that after c becomes true, e may be true with probability at least p in less than t time units, the following: c ⁇ p ⁇ t e may be written.
- Prime facie, or potential, causes may be defined as follows: c is a prima facie cause of e iff:
- the probability of a path may be defined as the product of the transition probabilities along the path.
- input data may be in the form of domain specific knowledge and the amount of time between cause and effect in terms of a window of time may be desired.
- a window of time in which e occurs (say, between t 1 and t 2 inclusive) after c occurs may be represented by: c ⁇ p ⁇ t2, ⁇ t1 e (2)
- causal relationships may be inferred from at least 3 variables, where states from which it is also possible to transition to an e state may be examined to determine if they could provide more information than just c.
- Testing for spurious relationships may occur using the following method.
- X being the set of prima facie causes of E
- the predictive value of c in relation to x may be calculated.
- the probability of transitioning to an e state from a c ⁇ x state versus a c ⁇ x state may be determined. If these probabilities are very similar, then c might be a spurious cause of e. However, there may only be one such x, while there may be a number of other x's where there is a large difference in the computed probabilities.
- One example of such a case is where there are two genuine causes of a common effect.
- ⁇ avg may be used to determine whether c is a valid cause.
- a cause, c may be an ⁇ -spurious cause of an effect, e, if: c is a prima facie cause of e and ⁇ avg ⁇ .
- ⁇ is a pre-defined threshold or may be determined using statistical methods.
- a prima facie cause of an effect, e may be a genuine cause of e if it is not an ⁇ -spurious cause of e.
- S smoking
- Y yellow stained fingers
- C lung cancer
- a cause may not be immediately ruled out as being spurious if there only exists another cause that is an equally good predictor of the effect, as long as with regard to other causes, it is still causally relevant to the effect.
- these may be independent causes of a common effect, or they may be supplementary causes. That is, in combination the causes may predict their effects better than each cause alone.
- two prima facie causes c and d are supplementary causes of an effect e if:
- c and d may be logical formulas.
- the same or exemplary formulas for spuriousness may apply, and it is possible that supplementary causes may be defined in terms of some ⁇ as well, possibly ensuring that the conjunction of the two causes adds significantly to predicting the effect.
- the problem can become one of determining when the model satisfies the formulas of interest. Described herein is exemplary logic and/or procedure which may be used to test for causal relationships. Model checking may involve testing whether a given system satisfies some temporal logic formula. If the problem may be encoded in such a framework, then conventional methods and/or procedures for hypothesis generation and refutation may be used.
- CTL Computation Tree Logic
- S is a finite set of states
- T is a transition probability function, T: S ⁇ S ⁇ [0, 1] such that for all s in S:
- L is a labeling function assigning atomic propositions to states, L:S ⁇ 2 A (6)
- the exemplary truth values of formulas for specific structures may be defined in terms of their satisfaction relations as shown herein.
- k ⁇ (state s satisfies atomic proposition ⁇ ) if ⁇ L(s).
- ⁇ m -measure is the sum of probabilities over the set of paths from s that satisfy f.
- inferences may be restricted in terms of the type of formulas tested and the length of time between cause and effect.
- the exemplary formula of interest may vary depending on the data being analyzed as well as background knowledge. Described herein is an exemplary embodiment of a method and/or a procedure that may be used when there is no prior knowledge.
- the time between cause and effect may be restricted to be either one time unit or some fixed length of time.
- a further exemplary restriction may be to look only for formulas that are conjunctions of events. In the simplest exemplary case, where there is only one unit of time between cause and effect and only conjunctions of events are being tested, a set of formulas may be used to test each event as a possible prima facie cause of each other event.
- the prima facie causes of common effects may be evaluated to determine whether any are supplementary causes (replacing the two original prima facie causes in the set of causes with the resulting conjunction of causes). Further, for each set of prima facie causes of an effect, spuriousness may be tested as described herein.
- the complexity of testing whether the model satisfies the formula may also be analyzed as follows.
- the complexity of forming the model can depend on the upper bound on time windows,
- the exemplary idea may be that states may be labeled with subformulas that are true within them, incrementally building the full formula.
- the time complexity of this algorithm may be shown to be O(t max *(
- embodiments within the scope of the present invention include computer-accessible medium for carrying or having computer-executable instructions or data structures stored thereon.
- Such computer-accessible medium may be any available media that can be accessed by a general purpose or special purpose computer.
- Such computer-accessible medium may comprise RAM, ROM, EEPROM, CD-ROM or other optical disk storage, magnetic disk storage or other magnetic storage devices, or any other medium which can be used to carry or store desired program code means in the form of computer-executable instructions or data structures and which can be accessed by a general purpose or special purpose computer.
- Computer-executable instructions comprise, for example, instructions and data which cause a general purpose computer, special purpose computer, special purpose processing device or other devices (e.g., mobile phone, personal digital assistant, etc.) with embedded computational modules etc. to perform a certain function or group of functions.
- the invention may be practiced in network computing environments with many types of computer system configurations, including personal computers, hand-held devices, multi-processor systems, microprocessor-based or programmable consumer electronics, network PCs, minicomputers, mainframe computers, and the like.
- the invention may also be practiced in distributed computing environments where tasks are performed by local and remote processing devices that are linked (either by hardwired links, wireless links, or by a combination of hardwired or wireless links) through a communications network.
- program modules may be located in both local and remote memory storage devices.
- Exemplary embodiments of the present invention may be used, e.g., to find patterns and/or relationships in financial time-based data series, such as stock market data.
- financial time-based data series such as stock market data.
- S&P Standard and Poors
- the data includes closing prices during 22 trading days for the 509 stocks that were part of the S&P 500 at some point during July 2002.
- Data for each trading day was provided in a single file, containing all stock symbols in the S&P 500 for that day, their closing price, and other information. This data was then transformed such that for each stock, there was a series of 22 (date, price) pairs. Then, a series of pairs containing numerical values comparing each price to the price of the prior day was generated as a string.
- Such strings were generated as follows: if the price at the end of a certain day is greater than the prior day, that day is represented by “U” for that stock; if the price is less than the prior day, it is represented by “D”; if there is no change, it is represented by “N” and if that stock was not traded or not part of the S&P 500 that day, it was represented by “I.” Numerical values representing each day's percent change were also generated.
- each stock was represented by a string such as, e.g., “UDDDINNUNDIDN”, where each letter corresponds to a particular date. Such representation may be referred to as a Gantt chart for the stock.
- Gantt chart for the stock.
- each stock's numerical data, Gantt chart and other associated information were assembled into a database.
- the data included the stock's full name, GICS, and industry sector.
- MCD and DD maintained a correlation similar to that shown in FIG. 5 . They appear to be correcting themselves—e.g., moving together, then diverging briefly (with one going up when the other goes down) and coming back together. This type of relationship was also found for pairs such as SBUX (Starbucks) and CCE (Coca-Cola Enterprises), shown in FIG. 6 , as well as for GPS(Gap) and NKE (Nike), shown in FIG. 7 .
- the 20 data sets represented 5 different causal structures, with 2 sets of 100,000 firings generated with each structure for a low and high noise level.
- the structures were all DAGs and ranged from long chains of neurons, to binary trees. Two of the causal structures are shown in FIGS. 11 and 12 .
- the exemplary structure shown in FIG. 11 would seem to pose a problem, given the many-to-many relationships.
- A, B and C were all identified as genuine causes of Y, while all other factors (including Z) were ruled out.
- E, F and D were equally relevant to P, while other factors had very low causal relevance, as measured by ⁇ avg .
- A, B, C had higher causal relevance to Y than E, F, D did to P (particularly in the high-noise dataset), due to the fact that the pattern is not always repeated in its entirety, and there were fewer examples of the later relationships in the series than there were of the earlier ones.
Abstract
Description
-
- A) A common format for input data (which may be suitable for multiple types of data);
- B) A database with at least one data structure (e.g., a phytogenic type tree, any network structure, a graph, a cladogram, a gantt chart, etc.);
- C) An integrated comparison procedure for organizing at least one data structure after insertion of input data into the database;
- D) An interface for user interaction with the above three components. In an exemplary embodiment, the interface may optionally include one or more of the following:
- i) A graphical user interface(GUI) that allows access to the database;
- ii) A visualizer to display the data structure;
- iii) Tools for graphical comparison and navigation of the data structure's components; and
- iv) further optimization and additions to the GUI and related navigation tools
Various subsets of the above listed components may be assembled in exemplary embodiments of the present invention.
Exemplary Input Data.
| Loop for each item in the dataset { |
| with w being the chosen size of the time window; |
| Collect the average for each collection of columns of width w in the |
| set of columns describing the data's numerical components (i.e. |
| starting from a column referred to as 0, average 0 to w, w to 2w and |
| so on until no more columns with numerical data remain); |
| For each average computed{ |
| convert the number to a character representing its level of activity |
| as it relates to 0. Characters used are U (greater than zero), D (less than |
| zero), N (exactly zero), and I denoting that there is no activity of the entry |
| at that point in time.}; |
| Create an object and store the entry's Unique ID as well as describing |
| string (as defined by the character representations of the numerical |
| averages) |
| } |
Score=Alignment(StringX,StringY)−ρ*|NumericalX-NumericalY|2+κ*Jaccard(GenesX, GenesY),
where
Jaccard(A,B)=Intersection(A,B)/Union(A,B).
-
- Else, remove c from candidates;
- If f1 and f2 are state formulas, so are −f1, (f1^f2),(f1{hacek over ( )}f2), (f1→f2);
- If f1 and f2 are state formulas, and t is a nonnegative integer or ∞, then f1U≦tf2 and f1U≦tf2 are path formulas; and
- If f a path formula and p is a real number with 0≦p≦1, then [f]≧p and [f]>p are state formulas.
f1
c
With εx =P(e|c
the following may be determined:
L:S→2A (6)
Claims (26)
Priority Applications (1)
| Application Number | Priority Date | Filing Date | Title |
|---|---|---|---|
| US12/124,753 US8090747B2 (en) | 2007-05-21 | 2008-05-21 | Method, system, computer-accessible medium and software arrangement for organization and analysis of multiple sets of data |
Applications Claiming Priority (2)
| Application Number | Priority Date | Filing Date | Title |
|---|---|---|---|
| US93924907P | 2007-05-21 | 2007-05-21 | |
| US12/124,753 US8090747B2 (en) | 2007-05-21 | 2008-05-21 | Method, system, computer-accessible medium and software arrangement for organization and analysis of multiple sets of data |
Publications (2)
| Publication Number | Publication Date |
|---|---|
| US20090006460A1 US20090006460A1 (en) | 2009-01-01 |
| US8090747B2 true US8090747B2 (en) | 2012-01-03 |
Family
ID=40161904
Family Applications (1)
| Application Number | Title | Priority Date | Filing Date |
|---|---|---|---|
| US12/124,753 Expired - Fee Related US8090747B2 (en) | 2007-05-21 | 2008-05-21 | Method, system, computer-accessible medium and software arrangement for organization and analysis of multiple sets of data |
Country Status (1)
| Country | Link |
|---|---|
| US (1) | US8090747B2 (en) |
Cited By (2)
| Publication number | Priority date | Publication date | Assignee | Title |
|---|---|---|---|---|
| US20150134704A1 (en) * | 2013-11-08 | 2015-05-14 | International Business Machines Corporation | Real Time Analysis of Big Data |
| US10140344B2 (en) | 2016-01-13 | 2018-11-27 | Microsoft Technology Licensing, Llc | Extract metadata from datasets to mine data for insights |
Families Citing this family (10)
| Publication number | Priority date | Publication date | Assignee | Title |
|---|---|---|---|---|
| US8171033B2 (en) * | 2008-09-30 | 2012-05-01 | Vmware, Inc. | Methods and systems for the determination of thresholds via weighted quantile analysis |
| US20120254200A1 (en) * | 2011-04-01 | 2012-10-04 | Zvi Lifshitz | User behavior based cognitive engine for data objects |
| US10210246B2 (en) | 2014-09-26 | 2019-02-19 | Oracle International Corporation | Techniques for similarity analysis and data enrichment using knowledge sources |
| US10891272B2 (en) | 2014-09-26 | 2021-01-12 | Oracle International Corporation | Declarative language and visualization system for recommended data transformations and repairs |
| US10976907B2 (en) | 2014-09-26 | 2021-04-13 | Oracle International Corporation | Declarative external data source importation, exportation, and metadata reflection utilizing http and HDFS protocols |
| US10810472B2 (en) | 2017-05-26 | 2020-10-20 | Oracle International Corporation | Techniques for sentiment analysis of data using a convolutional neural network and a co-occurrence network |
| US10936599B2 (en) | 2017-09-29 | 2021-03-02 | Oracle International Corporation | Adaptive recommendations |
| US10885056B2 (en) | 2017-09-29 | 2021-01-05 | Oracle International Corporation | Data standardization techniques |
| US11275768B2 (en) * | 2018-05-25 | 2022-03-15 | Salesforce.Com, Inc. | Differential support for frequent pattern analysis |
| CN109523453A (en) * | 2018-11-02 | 2019-03-26 | 中山大学 | Reversible information based on diamond shape prediction and image pixel sequence hides and extracting method |
Citations (18)
| Publication number | Priority date | Publication date | Assignee | Title |
|---|---|---|---|---|
| US5774719A (en) * | 1993-01-08 | 1998-06-30 | Digital Equipment Corporation | Method for comparing data structures that cross address space boundaries |
| US5933821A (en) * | 1996-08-30 | 1999-08-03 | Kokusai Denshin Denwa Co., Ltd | Method and apparatus for detecting causality |
| US5956726A (en) * | 1995-06-05 | 1999-09-21 | Hitachi, Ltd. | Method and apparatus for structured document difference string extraction |
| US6052686A (en) * | 1997-07-11 | 2000-04-18 | At&T Corporation | Database processing using schemas |
| US6502112B1 (en) * | 1999-08-27 | 2002-12-31 | Unisys Corporation | Method in a computing system for comparing XMI-based XML documents for identical contents |
| US20030061200A1 (en) * | 2001-08-13 | 2003-03-27 | Xerox Corporation | System with user directed enrichment and import/export control |
| US6658626B1 (en) * | 1998-07-31 | 2003-12-02 | The Regents Of The University Of California | User interface for displaying document comparison information |
| US6687693B2 (en) * | 2000-12-18 | 2004-02-03 | Ncr Corporation | Architecture for distributed relational data mining systems |
| US20040093347A1 (en) * | 2002-11-13 | 2004-05-13 | Aditya Dada | Mechanism for comparing content in data structures |
| US6741998B2 (en) * | 2000-07-18 | 2004-05-25 | Aegis Analytical Corporation | System, method and computer program for mapping a hierarchical display of process data of multi-database origins |
| US6757675B2 (en) * | 2000-07-24 | 2004-06-29 | The Regents Of The University Of California | Method and apparatus for indexing document content and content comparison with World Wide Web search service |
| US6839714B2 (en) * | 2000-08-04 | 2005-01-04 | Infoglide Corporation | System and method for comparing heterogeneous data sources |
| US20050015391A1 (en) * | 2001-09-10 | 2005-01-20 | Siemens Aktiengesellschaft | Visualization of a comparison result of at least two data structures organized in directory trees |
| US6915282B1 (en) * | 2000-10-26 | 2005-07-05 | Agilent Technologies, Inc. | Autonomous data mining |
| US6928436B2 (en) * | 2002-02-28 | 2005-08-09 | Ilog Sa | Interactive generation of graphical visualizations of large data structures |
| US20050216206A1 (en) * | 2002-05-31 | 2005-09-29 | Microsoft Corporation | Systems, methods and apparatus for reconstructing phylogentic trees |
| US7747605B2 (en) * | 2006-04-17 | 2010-06-29 | Perry J. Narancic | Organizational data analysis and management |
| US20110059860A1 (en) * | 2003-08-01 | 2011-03-10 | Dna Twopointo Inc. | Systems and methods for biopolymer engineering |
-
2008
- 2008-05-21 US US12/124,753 patent/US8090747B2/en not_active Expired - Fee Related
Patent Citations (21)
| Publication number | Priority date | Publication date | Assignee | Title |
|---|---|---|---|---|
| US5774719A (en) * | 1993-01-08 | 1998-06-30 | Digital Equipment Corporation | Method for comparing data structures that cross address space boundaries |
| US5956726A (en) * | 1995-06-05 | 1999-09-21 | Hitachi, Ltd. | Method and apparatus for structured document difference string extraction |
| US6526410B1 (en) * | 1995-06-05 | 2003-02-25 | Hitachi, Ltd. | Method and apparatus for structured document difference string extraction |
| US5933821A (en) * | 1996-08-30 | 1999-08-03 | Kokusai Denshin Denwa Co., Ltd | Method and apparatus for detecting causality |
| US6052686A (en) * | 1997-07-11 | 2000-04-18 | At&T Corporation | Database processing using schemas |
| US6658626B1 (en) * | 1998-07-31 | 2003-12-02 | The Regents Of The University Of California | User interface for displaying document comparison information |
| US6502112B1 (en) * | 1999-08-27 | 2002-12-31 | Unisys Corporation | Method in a computing system for comparing XMI-based XML documents for identical contents |
| US6741998B2 (en) * | 2000-07-18 | 2004-05-25 | Aegis Analytical Corporation | System, method and computer program for mapping a hierarchical display of process data of multi-database origins |
| US6757675B2 (en) * | 2000-07-24 | 2004-06-29 | The Regents Of The University Of California | Method and apparatus for indexing document content and content comparison with World Wide Web search service |
| US6839714B2 (en) * | 2000-08-04 | 2005-01-04 | Infoglide Corporation | System and method for comparing heterogeneous data sources |
| US6915282B1 (en) * | 2000-10-26 | 2005-07-05 | Agilent Technologies, Inc. | Autonomous data mining |
| US6687693B2 (en) * | 2000-12-18 | 2004-02-03 | Ncr Corporation | Architecture for distributed relational data mining systems |
| US20030061200A1 (en) * | 2001-08-13 | 2003-03-27 | Xerox Corporation | System with user directed enrichment and import/export control |
| US20050015391A1 (en) * | 2001-09-10 | 2005-01-20 | Siemens Aktiengesellschaft | Visualization of a comparison result of at least two data structures organized in directory trees |
| US7373613B2 (en) * | 2001-09-10 | 2008-05-13 | Siemens Ag | Visualization of a comparison result of at least two data structures organized in directory trees |
| US6928436B2 (en) * | 2002-02-28 | 2005-08-09 | Ilog Sa | Interactive generation of graphical visualizations of large data structures |
| US20050216206A1 (en) * | 2002-05-31 | 2005-09-29 | Microsoft Corporation | Systems, methods and apparatus for reconstructing phylogentic trees |
| US20040093347A1 (en) * | 2002-11-13 | 2004-05-13 | Aditya Dada | Mechanism for comparing content in data structures |
| US7353225B2 (en) * | 2002-11-13 | 2008-04-01 | Sun Microsystems, Inc. | Mechanism for comparing content in data structures |
| US20110059860A1 (en) * | 2003-08-01 | 2011-03-10 | Dna Twopointo Inc. | Systems and methods for biopolymer engineering |
| US7747605B2 (en) * | 2006-04-17 | 2010-06-29 | Perry J. Narancic | Organizational data analysis and management |
Non-Patent Citations (1)
| Title |
|---|
| Samantha Kleinberg et al., "CLARITY: Algorithms for Semantic Comparison of Time-course Transcriptomic Data", American Association for Artificial Intelligence, 2006, pp. 1-5. |
Cited By (2)
| Publication number | Priority date | Publication date | Assignee | Title |
|---|---|---|---|---|
| US20150134704A1 (en) * | 2013-11-08 | 2015-05-14 | International Business Machines Corporation | Real Time Analysis of Big Data |
| US10140344B2 (en) | 2016-01-13 | 2018-11-27 | Microsoft Technology Licensing, Llc | Extract metadata from datasets to mine data for insights |
Also Published As
| Publication number | Publication date |
|---|---|
| US20090006460A1 (en) | 2009-01-01 |
Similar Documents
| Publication | Publication Date | Title |
|---|---|---|
| US8090747B2 (en) | Method, system, computer-accessible medium and software arrangement for organization and analysis of multiple sets of data | |
| Angelino et al. | Learning certifiably optimal rule lists for categorical data | |
| Kantardzic | Data mining: concepts, models, methods, and algorithms | |
| Rokach | Pattern classification using ensemble methods | |
| WO2020198855A1 (en) | Method and system for mapping text phrases to a taxonomy | |
| Kumar et al. | A benchmark to select data mining based classification algorithms for business intelligence and decision support systems | |
| Datta et al. | Clustering with missing features: a penalized dissimilarity measure based approach | |
| Goldstein et al. | A scaling approach to record linkage | |
| Bonaccorso | Hands-On Unsupervised Learning with Python: Implement machine learning and deep learning models using Scikit-Learn, TensorFlow, and more | |
| Chao et al. | A cost-sensitive multi-criteria quadratic programming model for imbalanced data | |
| Nguyen et al. | Subgraph mining in a large graph: A review | |
| Marmolejo‐Ramos et al. | Distributional regression modeling via generalized additive models for location, scale, and shape: An overview through a data set from learning analytics | |
| US20230244869A1 (en) | Systems and methods for classification of textual works | |
| Roozbahani et al. | Community detection in multi-relational directional networks | |
| Guoliang | Knowledge Discovery with Bayesian Networks | |
| Li | Anomaly detection and predictive analytics for financial risk management | |
| Gsponer et al. | Background knowledge injection for interpretable sequence classification | |
| US20230237722A1 (en) | Apparatus, system, and method for generating a video avatar | |
| Hwang et al. | XClusters: explainability-first clustering | |
| Bashar et al. | ALGAN: Time Series Anomaly Detection with Adjusted-LSTM GAN | |
| Yang et al. | Learning social networks from text data using covariate information | |
| US20230289671A1 (en) | Apparatus and methods for success probability determination for a user | |
| Cheng | Towards accurate and efficient classification: A discriminative and frequent pattern-based approach | |
| Dinov | Supervised Classification | |
| Hanjo | Data Mining: Concepts, Models, Methods, and Algorithams |
Legal Events
| Date | Code | Title | Description |
|---|---|---|---|
| AS | Assignment |
Owner name: NEW YORK UNIVERSITY, NEW YORK Free format text: ASSIGNMENT OF ASSIGNORS INTEREST;ASSIGNORS:KLEINBERG, SAMANTHA;MISHRA, BHUBANESWAR;REEL/FRAME:020980/0318;SIGNING DATES FROM 20070519 TO 20070521 Owner name: NEW YORK UNIVERSITY, NEW YORK Free format text: ASSIGNMENT OF ASSIGNORS INTEREST;ASSIGNORS:KLEINBERG, SAMANTHA;MISHRA, BHUBANESWAR;SIGNING DATES FROM 20070519 TO 20070521;REEL/FRAME:020980/0318 |
|
| ZAAA | Notice of allowance and fees due |
Free format text: ORIGINAL CODE: NOA |
|
| ZAAB | Notice of allowance mailed |
Free format text: ORIGINAL CODE: MN/=. |
|
| STCF | Information on status: patent grant |
Free format text: PATENTED CASE |
|
| FPAY | Fee payment |
Year of fee payment: 4 |
|
| MAFP | Maintenance fee payment |
Free format text: PAYMENT OF MAINTENANCE FEE, 8TH YEAR, LARGE ENTITY (ORIGINAL EVENT CODE: M1552); ENTITY STATUS OF PATENT OWNER: LARGE ENTITY Year of fee payment: 8 |
|
| FEPP | Fee payment procedure |
Free format text: MAINTENANCE FEE REMINDER MAILED (ORIGINAL EVENT CODE: REM.); ENTITY STATUS OF PATENT OWNER: LARGE ENTITY |
|
| LAPS | Lapse for failure to pay maintenance fees |
Free format text: PATENT EXPIRED FOR FAILURE TO PAY MAINTENANCE FEES (ORIGINAL EVENT CODE: EXP.); ENTITY STATUS OF PATENT OWNER: LARGE ENTITY |
|
| STCH | Information on status: patent discontinuation |
Free format text: PATENT EXPIRED DUE TO NONPAYMENT OF MAINTENANCE FEES UNDER 37 CFR 1.362 |
|
| FP | Lapsed due to failure to pay maintenance fee |
Effective date: 20240103 |