US7945472B2 - Business management tool - Google Patents
Business management tool Download PDFInfo
- Publication number
- US7945472B2 US7945472B2 US11/056,040 US5604005A US7945472B2 US 7945472 B2 US7945472 B2 US 7945472B2 US 5604005 A US5604005 A US 5604005A US 7945472 B2 US7945472 B2 US 7945472B2
- Authority
- US
- United States
- Prior art keywords
- sales
- revenue
- data
- plan
- calculating
- Prior art date
- Legal status (The legal status is an assumption and is not a legal conclusion. Google has not performed a legal analysis and makes no representation as to the accuracy of the status listed.)
- Expired - Fee Related, expires
Links
Images


Classifications
-
- G—PHYSICS
- G06—COMPUTING; CALCULATING OR COUNTING
- G06Q—INFORMATION AND COMMUNICATION TECHNOLOGY [ICT] SPECIALLY ADAPTED FOR ADMINISTRATIVE, COMMERCIAL, FINANCIAL, MANAGERIAL OR SUPERVISORY PURPOSES; SYSTEMS OR METHODS SPECIALLY ADAPTED FOR ADMINISTRATIVE, COMMERCIAL, FINANCIAL, MANAGERIAL OR SUPERVISORY PURPOSES, NOT OTHERWISE PROVIDED FOR
- G06Q10/00—Administration; Management
- G06Q10/06—Resources, workflows, human or project management; Enterprise or organisation planning; Enterprise or organisation modelling
- G06Q10/063—Operations research, analysis or management
- G06Q10/0631—Resource planning, allocation, distributing or scheduling for enterprises or organisations
- G06Q10/06311—Scheduling, planning or task assignment for a person or group
- G06Q10/063112—Skill-based matching of a person or a group to a task
-
- G—PHYSICS
- G06—COMPUTING; CALCULATING OR COUNTING
- G06Q—INFORMATION AND COMMUNICATION TECHNOLOGY [ICT] SPECIALLY ADAPTED FOR ADMINISTRATIVE, COMMERCIAL, FINANCIAL, MANAGERIAL OR SUPERVISORY PURPOSES; SYSTEMS OR METHODS SPECIALLY ADAPTED FOR ADMINISTRATIVE, COMMERCIAL, FINANCIAL, MANAGERIAL OR SUPERVISORY PURPOSES, NOT OTHERWISE PROVIDED FOR
- G06Q10/00—Administration; Management
- G06Q10/06—Resources, workflows, human or project management; Enterprise or organisation planning; Enterprise or organisation modelling
- G06Q10/063—Operations research, analysis or management
- G06Q10/0635—Risk analysis of enterprise or organisation activities
-
- G—PHYSICS
- G06—COMPUTING; CALCULATING OR COUNTING
- G06Q—INFORMATION AND COMMUNICATION TECHNOLOGY [ICT] SPECIALLY ADAPTED FOR ADMINISTRATIVE, COMMERCIAL, FINANCIAL, MANAGERIAL OR SUPERVISORY PURPOSES; SYSTEMS OR METHODS SPECIALLY ADAPTED FOR ADMINISTRATIVE, COMMERCIAL, FINANCIAL, MANAGERIAL OR SUPERVISORY PURPOSES, NOT OTHERWISE PROVIDED FOR
- G06Q10/00—Administration; Management
- G06Q10/06—Resources, workflows, human or project management; Enterprise or organisation planning; Enterprise or organisation modelling
- G06Q10/063—Operations research, analysis or management
- G06Q10/0637—Strategic management or analysis, e.g. setting a goal or target of an organisation; Planning actions based on goals; Analysis or evaluation of effectiveness of goals
- G06Q10/06375—Prediction of business process outcome or impact based on a proposed change
-
- G—PHYSICS
- G06—COMPUTING; CALCULATING OR COUNTING
- G06Q—INFORMATION AND COMMUNICATION TECHNOLOGY [ICT] SPECIALLY ADAPTED FOR ADMINISTRATIVE, COMMERCIAL, FINANCIAL, MANAGERIAL OR SUPERVISORY PURPOSES; SYSTEMS OR METHODS SPECIALLY ADAPTED FOR ADMINISTRATIVE, COMMERCIAL, FINANCIAL, MANAGERIAL OR SUPERVISORY PURPOSES, NOT OTHERWISE PROVIDED FOR
- G06Q10/00—Administration; Management
- G06Q10/06—Resources, workflows, human or project management; Enterprise or organisation planning; Enterprise or organisation modelling
- G06Q10/063—Operations research, analysis or management
- G06Q10/0639—Performance analysis of employees; Performance analysis of enterprise or organisation operations
- G06Q10/06393—Score-carding, benchmarking or key performance indicator [KPI] analysis
-
- G—PHYSICS
- G06—COMPUTING; CALCULATING OR COUNTING
- G06Q—INFORMATION AND COMMUNICATION TECHNOLOGY [ICT] SPECIALLY ADAPTED FOR ADMINISTRATIVE, COMMERCIAL, FINANCIAL, MANAGERIAL OR SUPERVISORY PURPOSES; SYSTEMS OR METHODS SPECIALLY ADAPTED FOR ADMINISTRATIVE, COMMERCIAL, FINANCIAL, MANAGERIAL OR SUPERVISORY PURPOSES, NOT OTHERWISE PROVIDED FOR
- G06Q30/00—Commerce
- G06Q30/02—Marketing; Price estimation or determination; Fundraising
- G06Q30/0201—Market modelling; Market analysis; Collecting market data
- G06Q30/0202—Market predictions or forecasting for commercial activities
Definitions
- the present invention relates generally to software-based methods and tools for managing a business, and more particularly the present invention relates to a method of managing a business through integrated planning, performance and forecasting modules.
- the present invention includes a business management tool that is configured to receive and process both first and second data sources for planning, performance and forecasting purposes.
- the business management tool of the present invention is further configured to utilize essential data related to productivity, hiring and seasonality for the planning, performance and forecasting purposed noted above.
- the business management tool of the present invention is adapted to advise managers of those conditions and variables that subject the business to the most risk in the planning and forecasting duties.
- the business management tool of the present invention is preferably embodied in a methodology executed through a software-based medium.
- the method includes the steps of providing a plurality of key performance indicators, such as for example quarterly seasonality and new hire productivity.
- the method further includes the step of providing a first set of data including data related to the business and a second set of data including data related to an industry of which the business is a part.
- the method further includes the step of providing an integrated management system including a planning module, a performance management module and a forecasting module.
- the method of the present invention operates by inputting the plurality of key performance indicators, the first set of data and the second set of data into the integrated management system.
- the planning module, performance management module and forecasting module are adapted to receive selected portions of the plurality of key performance indicators, the first set of data and the second set of data for computational purposes and perform various computations and analyses thereof.
- a user can better manage the planning, performance and forecasting aspects of the business.
- the present invention provides a manager with an integrated methodology for making informed decisions and accurate predictions concerning the business. Further advantages and details of the present invention are fully described herein in its preferred embodiments with reference to the following drawings.
- FIG. 1A is a graphical representation showing the relationship between business opportunities and time for a number of sales resources.
- FIG. 1B is a split graphical representation showing the relationship between business opportunities and time for a single sales resource.
- FIG. 2 is a schematic block diagram of the methodology of the present invention.
- FIG. 3 is a schematic block diagram of a group of data sets utilized by the present invention.
- FIG. 4 is a schematic block diagram of the integration of the present invention.
- FIG. 5 is a schematic block diagram of a group of key performance indicators utilized by the present invention.
- FIG. 6 is a flow chart depicting a method of creating a revenue plan in accordance with the present invention.
- FIG. 7 is a flow chart depicting a method of calculating a revenue plan in accordance with the present invention.
- FIG. 8 is a flow chart depicting a method of calculating the sales activity needed to meet a revenue plan in accordance with the present invention.
- FIG. 9 is a flow chart depicting a method of assessing the risk associated with a revenue plan in accordance with the present invention.
- FIG. 10 is a flow chart depicting a method of managing a revenue plan in accordance with the present invention.
- FIG. 11 is a flow chart depicting a method of managing performance in accordance with the present invention.
- FIG. 12 is a flow chart depicting a method of managing performance by flow and yield in accordance with the present invention.
- FIG. 13 is a flow chart depicting a method of managing performance through the creation of scenarios in accordance with the present invention.
- FIG. 14 is a flow chart depicting a method of managing forecast performance in accordance with the present invention.
- FIG. 15 is a flow chart depicting a method of managing forecast performance through historical analysis in accordance with the present invention.
- FIG. 16 is a flow chart depicting a method of managing forecast performance through historical data and year-to-date accuracy data with respect to revenue and opportunity count in accordance with the present invention.
- FIG. 17 is a flow chart depicting a method of managing forecast performance through the creation of scenarios in accordance with the present invention.
- FIG. 18 is a flow chart depicting a method calculating expected revenue in accordance with the present invention.
- FIG. 19 is a flow chart depicting a method of determining forecast accuracy in accordance with the present invention.
- FIG. 20 is a flow chart depicting a method of analyzing risk associated with forecast projections in accordance with the present invention.
- the present invention provides a tool for integrating the planning, performance and forecasting aspects of business management into a single methodology for use by a business manager.
- the business management tool of the present invention utilizes a discrete set of variables as inputs for rendering a series of outputs through which a business manager make decisions regarding his or her sales force.
- the business management tool of the present invention is embodied in a methodology that is preferably operable in a software-based medium.
- integration of the method of the present invention into a computational system provides a user with sufficient computational power and storage capacity to effectively manage the data processing and statistical power of the present invention.
- FIG. 1A is a graphical representation showing the relationship between business opportunities and time for a number of sales resources, designated A, B and C.
- a sales resource is one of a sales representative or a channel resource, such as direct mail, Internet or some other form of directed advertising and selling of a product.
- the vertical axis is a measure of opportunities, wherein the term “opportunities” will refer to a sales opportunity that a sales representative or channel resource has at any given time.
- the horizontal axis is a measure of time.
- the purpose of the present invention is to accurately measure, analyze and predict the shape of the curve represented by D N over the life of a business. More preferably, business managers can best utilize the present invention to reduce the slope of the sales pipeline by increasing the yield of sales from current and future sales opportunities and by more accurately forecasting the number of opportunities needed by any sales resource at any time to ensure proper growth and profitability.
- the detailed methodology by which the present invention accomplishes this goal is set forth below.
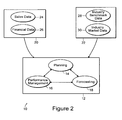
- FIG. 2 is a schematic block diagram of the methodology of the present invention.
- the business management system 10 of the present invention generally includes an integrated subsystem 12 having a planning node 14 , a performance management node 16 and a forecasting node 18 .
- the integrated subsystem 12 operates in response to data derived from a first data source 20 and a second data source 22 .
- the first data source 20 includes a sales data 24 component and a financial data 26 component.
- the second data source 22 includes an industry benchmark data 28 component and an industry market data 30 component.
- the industry benchmark data 28 and the industry market data 30 are at least partially comprised of anonymous data supplied by each business that utilizes the business management tool of the present invention.
- each user can submit his or her company's data into the industry benchmark data 28 and industry market data 30 pool for viewing and analysis by the remaining users of the present invention.
- the present invention supplies its users with comparative data from within its industry competitors thus allowing each company to further develop and improve its own business practices.
- the anonymous nature of the submissions that form the industry benchmark data 28 and industry market data 30 will not jeopardize the individual business practices of any participating business.
- FIG. 3 is a schematic block diagram of a group of data sets utilized by the present invention.
- the sales data 24 is a composite of several data sources including a current sales performance data 32 , a sales hiring data 34 , an active sales opportunities data 36 , a past sales opportunities data 38 and a past sales performance data 40 .
- the financial data 26 is a composite of a corporate expense data 42 , a sales expense data 44 and a customer purchase history data 46 . Together, the sales data 24 and financial data 26 form the first data source 20 that is inputted into the integrated subsystem 12 .
- the industry benchmark data 28 is a composite of the current sales performance data 32 , the sales hiring data 34 , the active sales opportunities data 36 , the past sales opportunities data 38 , the past sales performance data 40 , the corporate expense data 42 , the sales expense data 44 and the customer purchase history data 46 .
- these data sources are provided to the users of the present invention on an anonymous basis such that each user can make comparative analyses of its business practices as compared to the industry as a whole.
- the industry market data 30 is a composite of the current sales performance data 32 , the sales hiring data 34 , the active sales opportunities data 36 , the past sales opportunities data 38 , the past sales performance data 40 , the corporate expense data 42 and a company information data 48 , which is currently available information concerning companies in the industry.
- the industry market data 30 is also a composite based in part on anonymous submissions of the users of the present invention, with the exception of the company information data 48 , which is presumed to be publicly available.
- FIG. 4 is a schematic block diagram of the integrated subsystem 12 of the present invention.
- the planning node 14 of the subsystem 12 includes two routines defined as the create revenue plan routine 100 and the manage revenue plan routine 200 .
- the performance management node 16 includes a manage performance routine 300 and a manage forecast performance routine 400 .
- the forecasting node 18 includes an expected revenue production routine 500 and a forecast accuracy projection routine 600 .
- Each of the foregoing routines is designed to implement a specific method, preferably in a software-based medium, for processing the data sets described above.
- FIG. 5 is a schematic block diagram of a group of key performance indicators (KPI) utilized in addition to the data sets described above for improving the management of a business.
- the key performance indicators include an average sales representative production 50 , a sales resource attrition rate 52 , a quarterly seasonality 54 , an average sales cycle yield by step 56 , an average new hire productivity curve 58 , a monthly seasonality 60 , an average transaction size 62 and an average sales cycle length by step 64 .
- the sales resource attrition rate 52 includes data related to the attrition of both sales representatives and channel partners, and thus incorporates all potential lost revenue for each revenue source used by the business.
- the KPI are inputted into the routines described above, for example the create revenue plan routine 100 and the manage revenue plan routine 200 .
- the KPI are specific to the company and industry utilizing the present invention, and serve to better describe the performance and output of each sales resource employed by the business.
- the KPI include data related to turnover, new hiring and seasonality they are particularly useful in the management and forecasting functions of the present invention.
- FIG. 6 is a flow chart depicting the methodology embedded in the create revenue plan routine 100 in accordance with the present invention.
- step S 102 at least one of the eight KPI described above is inputted into the routine. Preferably, all eight KPI are utilized in the create revenue plan routine 100 .
- a revenue plan is calculated following calculations that are described further herein with reference to FIG. 7 .
- step S 106 the method calculates the volume or amount of sales activity needed to meet the revenue plan, i.e. raw number of sales opportunities that are required to meet the calculated revenue plan.
- an expense plan is calculated using first data related to expenses.
- step S 110 the method creates a group of alternate scenarios that change the revenue plan, expense plan and other outputs by varying the various inputs.
- step S 112 the method simulates benchmark scenarios by utilizing the second data related to industry standards.
- step S 114 the method determines a territory coverage that establishes geographical parameters for properly calculating the revenue plan.
- step S 116 a user is permitted to modify the previously estimated revenue plan through user changes to the inputs, a process that results in the method beginning from step S 104 and recalculating the aforementioned parameters.
- step S 118 of the method a risk assessment of the revenue plan is performed as described in greater detail below.
- FIG. 7 is a flow chart depicting the steps of calculating the revenue plan shown as S 104 in FIG. 6 .
- step S 1042 the foregoing calculation is repeated for all sales representatives over a time period determined by the user, for example for an upcoming quarter.
- step S 1044 the method adjusts the revenue calculation for newly hired sales representatives and channel resources.
- the NHA calculation is needed to adjust the revenue calculation for each sales representative that leaves the business sales force during the period under examination.
- each sales representative that is lost or is anticipated to be lost during a certain time period is compensated for by an attrition adjustment, which assumes that a new hire is brought into the sales force upon the departure of each sales representative. Accordingly, the attrition adjustment of step S 1046 loops back to the NHA described in step S 1044 .
- a channel resource is a method or means of selling a product or service that is not a sales representative per se, but nevertheless is expected to generate a certain amount of sales on behalf of the company.
- the channel revenue (CR) is the product of the channel productivity (CProd), the channel start date relative to the measurement period (C start date), the sales quota of the channel resource (CQuota) and the number of channel resources (C n ).
- the method of the present invention includes step S 1050 that compensates for the attrition of channel resources by adding a new channel resource hire. As before, this compensation step requires that the method return to step S 1044 and compute a NHA value for each channel resource that is projected to be lost over the coming revenue plan period.
- the revenue plan is calculated in step S 1052 as the channel revenue added to the monthly revenue expected from the sales representatives.
- Each of these values is adjusted by the value of the NHA for the expected new hires as well as the attrition adjustment attributable to both the departing sales representatives and the departing channel resources.
- this method is employed to calculate the revenue plan according to step S 104 of the create revenue plan routine 100 .
- FIG. 8 is a flow chart depicting a method of calculating the sales activity needed to meet a revenue plan in accordance with step S 106 of the create revenue plan routine 100 .
- the sales activity needed to meet the revenue plan is calculated through calculations related to a group of the KPI described above.
- the method inputs the average sales cycle yield, Y.
- the method inputs the average sales cycle length, L.
- the method inputs the average sales amount, A.
- step S 1066 the method inputs the predicted revenue, R, as calculated in step S 1050 and described above.
- the method can arithmetically determine the number of opportunities required to generate the projected revenue, R, as shown in step S 1068 .
- step S 1070 the method described above is repeated for each sales resource, including both sales representatives and channel resources.
- the create revenue plan routine 100 includes a step that assesses the risks associated with the creation of the revenue plan as well as projecting a most probable value for the revenue plan based upon statistical analysis.
- the plurality of KPI inputs is inputted into the method at step S 1180 .
- a statistical distribution is applied to numerical values that comprise the KPI inputs, thus giving a range of input values for each of the KPI values.
- a statistical distribution is applied to the expense data determined before in step S 108 of the create revenue plan routine 100 .
- the method utilizes a Monte Carlo or other suitable statistical simulation algorithm to simulate a new revenue value based upon the probability distributions determined for the KPI values and the expense data.
- step S 1188 selects the most sensitive variables as those that embody a significant risk for the business. For example, if the statistical distribution about the average sales cycle length 64 results in a large variation in the simulated revenue, then the present invention will inform the user that this factor needs to be carefully monitored and managed to prevent unnecessary risk.
- the method of the present invention will preferably inform the user of this risk such that the user can make the appropriate adjustments to his or her management strategy in order to reduce the risk to the business.
- step S 1122 shows the user the most probable revenue plan values based upon the foregoing analysis of the statistically significant risk factors.
- the present method will also permit a user to project a revenue value by inputting a selected probability, i.e. in order to determine what revenue will be generated with 75% certainty.
- the manage revenue plan routine 200 is shown in detail in FIG. 10 .
- a manager will preferably use the manage revenue routine 200 to determine the variance between the actual and projected revenues of the business.
- the manage revenue routine 200 is adapted to create alternate scenarios in which the variance is altered through changes to the input variables.
- a manager can effectively track and make adjustments to the revenue plan and the current business practices in order to ensure a healthy and profitable revenue stream.
- the plurality of KPI variables is inputted into the method at step S 202 .
- the method calculates the actual revenue produced by the business.
- the method calculates the variance between the actual revenue produced by the business and the revenue projected under the create revenue plan routine 100 .
- the method calculates the volume or amount of sales activity needed to meet the revenue plan, i.e. raw number of sales opportunities that are required to meet the calculated revenue plan.
- changes to the expense plan are calculated using first data related to expenses.
- the method creates a group of alternate scenarios that change the revenue plan, expense plan and other outputs by varying selected inputs.
- step S 214 the method simulates benchmark scenarios by utilizing the second data related to industry standards.
- step S 216 the method determines a territory coverage that establishes geographical parameters for properly calculating the revenue plan.
- step S 218 a user is permitted to modify the results calculated by the method by varying the inputs, a process that results in the method beginning from step S 204 and recalculating the aforementioned parameters.
- step S 302 the method calculates the actual yield and flow for each sales representative and channel resource.
- the yield is defined as the ratio of closed sales to original opportunities during any sales process, or more preferably as the ration of closed sales to original opportunities by step in the sales process.
- the flow is defined as the rate at which the sales resources move between steps in a sales cycle. The calculations of step S 302 are discussed further with reference to FIG. 12 .
- step S 304 the method calculates the needed sales activity for each step in the sales process and at all times during the sales process to create a projected pipeline. That is, the method determines the raw number of sales opportunities required to met the revenue plan given the actual yield and flow calculated above.
- step S 306 the method compares the actual sales pipeline to the projected sales pipeline, the latter of which is based upon projected values for yield and flow.
- step S 308 the method compares the year-to-date (YTD) revenue performance to the expected yield from the current pipeline in order to project the annual performance of the business.
- the method adds the actual YTD revenues with those projected by the anticipated yield in order to arrive at a projected revenue value. That value is compared to the revenue plan calculated in the create revenue plan routine 100 and the variances are shown to the user.
- YTD year-to-date
- step S 310 the method inputs a probability of close for each sales opportunity in the pipeline, i.e. the statistical odds that any one opportunity will end in a closed deal or sale. This probability is multiplied by the projected sales amount, and then given the overall pipeline yield the method can calculate a projected yield amount in dollars.
- step S 312 the method compares the projected yield amount to the actual average yields for each sales representative and channel resource and calculates the variances.
- step S 314 the method displays a performance pattern for one or more sales resources, as defined by type or territory.
- the performance pattern is the relationship between the actual and projected yield for any sales resource.
- the performance pattern may be for all channel partners in the Northeast region of the United States, or alternatively for an individual sales representative in California.
- the method of the present invention supplies a user with the information needed to adapt the selling behavior of one or more sales resources as shown in step. S 316 .
- step S 318 the method creates a range of scenarios that allow a user to see variations in performance patterns, as further described in FIG. 13 .
- FIG. 12 is a flow chart detailing the calculations of actual flow and yield generally shown as step S 302 above.
- step S 3020 the method inputs the number of sales opportunities at the beginning of a sales process or pipeline, I S .
- step S 3022 the number I S is reduced by the number of opportunities at each step in the sales pipeline. The remaining number of opportunities will give the actual yield by step in the sales cycle, determined in step S 3024 .
- step S 3026 the overall time length of the sales process or pipeline is inputted into the method.
- step S 3028 the timing of each new opportunity and each lost opportunity is inputted into the method.
- the time to transition between steps in the sales process is inputted at step S 3030 ; and the times of the actual sales are inputted at step S 3032 .
- the method calculates the actual flow as well as the rate of opportunity loss or deal closure, at step S 3034 .
- the manage performance routine 300 includes a step for creating scenarios at S 318 .
- This step in the routine is illustrated in FIG. 13 .
- the scenario creation of step S 318 involves a group of options for the user.
- the revenue plan is recalculated based upon the YTD values for each of the input variables relevant to the create revenue routine 100 at step S 3182 .
- the user inputs the industry benchmark data 28 described above and then recalculates the yield based upon benchmark data for the plurality of KPI at step S 3186 .
- step S 3188 the user inputs variations to the KPI factors and then the yield is recalculated based upon changes to these KPI factors at step S 3190 .
- FIG. 14 is a flow chart depicting a method associated with the manage forecast performance routine 400 of the present invention.
- This particular routine involves the analysis and management of the predictive accuracy of the business, including the accuracy of projections made by the sales resources regarding opportunities and yield.
- the method calculates the historical forecast activity and accuracy, as further described with reference to FIG. 15 .
- the method calculates the historical and YTD accuracy in revenue and opportunity account for each sales representative and channel resource.
- step S 406 large variances in the forecast accuracy and forecast volume of opportunities are shown to the user.
- step S 408 the method compares the YTD performance of the business is compared to the revenue plan and the revenue projections are revised using the current revenue forecast and accuracy added to the actual YTD yield.
- the user can adapt his or her sales forecast and behavior in step S 410 to rectify any glaring overestimates with regard to forecast numbers.
- step S 412 the method notifies the user of any deviations between the historical and current forecast accuracies, in response to which the manager may wish to adapt his or her sales behavior.
- step S 414 the user is permitted to create scenarios for determining alternative outputs from this routine.
- FIG. 15 is a flow chart depicting the method of calculating the historical forecast activity and accuracy.
- the method inputs, for each sales resource, all forecast opportunities including the projected time and amount of sale.
- the method determines the actual time and amount of each sale previously forecast in step S 4020 .
- the method calculates the variance in time and amount between the projected and actual sales.
- the method calculates the factors determining the variance previously determined, i.e. the change in time of sale, change in amount of sale, and change in degree of certainty of sale.
- the method at step S 4028 then stores the variance in forecast and actual sales by sales resource such that the manager can more easily remedy forecast problems at the individual sales representative or channel resource level.
- FIG. 16 is a flow chart illustrating the particulars of step S 404 in which the historical and YTD accuracy in revenue and opportunity count is calculated for each sales representative and channel resource.
- the method inputs each sales representative and channel resource.
- the method calculates the historical accuracy in revenue and opportunity count for each entered sales resource.
- the method calculates the YTD accuracy in revenue and opportunity count for each sales resource.
- the method calculates the actual monthly sales production for each sales representative and channel resource measured back to the start date of the respective sales resource.
- step S 4048 the foregoing calculations are compared to the seasonality curves that form part of the KPI.
- step S 4050 the variance between the seasonality curves and the historical and YTD forecast accuracy calculations are calculated according to the method.
- the method of the present invention helps a manager determine whether inaccurate forecasting is more related to the particular sales resource or more related to the seasonality of the sales cycle.
- the comparison to the seasonality curves helps to “normalize” the accuracy of the foregoing calculations by eliminating a variable that is beyond the control of any sales resource.
- step S 414 of the manage forecast performance routine 400 involves the creation of scenarios, shown in detail in FIG. 17 .
- the create scenarios step S 414 involves at least a pair of options for the user including creating a scenario based upon industry benchmarks and creating a scenario based on user inputs.
- the method inputs a set of industry benchmark data regarding forecast accuracy, opportunity volume and count.
- the method compares the actual values of these variables to the selected industry benchmark data.
- the method recalculates the projected revenue based upon the industry benchmark data to clearly illustrate the variance between the performances of the business to the rest of the industry, wherein the industry benchmark data is anonymously supplied by other users of the present invention as described above.
- step S 4146 the user is permitted to input different accuracy values.
- the actual accuracy values were calculated in S 402 and S 404 . These values were for historical forecast accuracy and activity and historical and YTD accuracy in revenue and opportunity count for each sales resource. Changes to any one of these values will result in a change in the projected revenue of the business, as calculated in step S 4148 .
- FIG. 18 is a flow chart depicting a method of calculating expected revenue found in the expected revenue production routine 500 of the present invention.
- the method inputs data related to opportunities in the active sales pipeline for each sales representative and channel resource.
- the method inputs forecast sales opportunities for each sales representative and channel resource.
- the method inputs the plurality of KPI described above with reference to FIG. 5 .
- step S 508 the method calculates the future revenue from the sales pipeline as a function of time, FR(t).
- step S 510 the future revenue is calculated from the sales pipeline as a function of historical averages, FR(h).
- step S 512 the variations between the FR(t) and FR(h) are calculated and shown to the user to better display potential problems with productivity or opportunity count for any particular sales resource.
- step S 514 the foregoing calculations are repeated for each sales representative, channel resource, geographical region, product type and customer type.
- the manager will have an appreciation of the outputs of each and every sales resource across the range of the business, from which he or she can make adjustments to the sales practices in order to increase productivity or boost revenue.
- step S 516 the method calculates the expected revenue for each sales representative and channel resource as a sum of the YTD revenue and the projected revenue as calculated above.
- step S 518 the method displays sales performance patterns for each sales resource, thus permitting the manager to adjust the activity level, i.e. number of opportunities, directed to or from a sales resource depending upon performance.
- step S 520 the user is permitted to create scenarios by making input adjustments to the KPI factors inputted at step S 506 .
- a manager can calculate the expected revenue by any particular sales resource by adjusting a productivity level, introducing a new hire, or removing a seasonality curve.
- the present invention includes a forecast accuracy projection routine 600 for monitoring and analyzing the accuracy and risks associated with business forecasting.
- the particulars of the forecast accuracy projection routine 600 are shown in the flow chart of FIG. 19 .
- step S 602 the method inputs data on active sales pipeline opportunities, and in step S 604 the method inputs data on forecast sales opportunities.
- step S 606 the method inputs the plurality of KPI factors described in FIG. 5 .
- step S 608 the method calculates the future revenue from the sales pipeline as a function of time, FR(t).
- step S 610 the future revenue is calculated from the sales pipeline as a function of historical averages, FR(h).
- step S 612 the variations between the FR(t) and FR(h) are calculated and shown to the user to better display potential problems with productivity or opportunity count for any particular sales resource.
- step S 614 the foregoing calculations are repeated for each sales representative, channel resource, geographical region, product type and customer type. As before, at the conclusion of step S 614 the manager will have an appreciation of the outputs of each and every sales resource across the range of the business.
- step S 616 the method calculates the expected revenue for each sales representative and channel resource as a sum of the YTD revenue and the projected revenue as calculated above.
- step S 618 the method displays sales performance patterns for each sales resource, thus permitting the manager to adjust the activity level, i.e. number of opportunities directed to or from a sales resource depending upon performance.
- step S 620 the user is permitted to create scenarios by making input adjustments to the KPI factors inputted at step S 606 .
- the manager can use the scenarios to calculate the expected revenue by any particular sales resource by adjusting a productivity level, introducing a new hire, or removing a seasonality curve.
- step S 622 the method performs a risk assessment described in greater detail with reference to FIG. 20 .
- step S 624 the method calculates a statistical sensitivity analysis to identify major contributors to the risk-adjusted forecast outcome which permits the manager to better assess the volatility of making changes to hiring practices, resource allocation and the like.
- step S 6220 the method identifies highly correlated variables for forecasting accuracy, such as for example quarterly seasonality 54 and monthly seasonality 60 .
- step S 6222 the method performs a Monte Carlo or other statistical simulation of the revenue projections based upon statistical distributions of the highly correlated variables.
- step S 6224 the method permits a user to customize the statistical distribution based upon historical data, general statistical modeling principles or their understanding of unique sales opportunities.
- step S 6226 the method performs an iterative sampling of various scenarios using the highly correlated data set or user-set inputs.
- a user may specify a desired probability for a sale rather than rely on the historical accuracy of the forecasts by a particular sales representative.
- the user may determine what revenue will be generated with a predetermined degree of certainty, i.e. what revenue will be generated with a 75% degree of certainty.
- the result is a set of statistically significant forecast results that allow the manager to see those variables and conditions that contribute to fluctuations in the revenue outcome.
- the output of step S 6226 is a risk adjusted forecast.
- step S 6228 the method adds the risk adjusted forecast to the YTD revenue to create a risk adjusted revenue projection. The method further compares this value to the sales plan for the YTD projected performance measurement, thus clarifying any potentially risky conditions for the manager.
- step S 6230 the method identifies any statistically significant variables in the risk assessment by finding those variables that result in the largest swings in projected revenue.
- step S 6232 the method informs the user of any statistically high-risk areas, in response to which the manager may adjust or adapt his or her business practices to account for the inherent risks in business forecasting.
- the present invention provides a novel and useful methodology for managing a business using selected data.
- the present invention utilizes a discrete set of data that can be input into an integrated planning, performance and forecasting system for managing virtually all aspects of a business.
- the present invention integrates historical data, projected data and forecasting data to constantly provide a user with current and accurate information and projections. As time passes and projected data becomes historical data, the present invention allows a user to seamlessly adjust the new revenue plans, hiring practices and forecasts.
- the planning and forecasting aspects of the present invention allow users to more accurately assess the risks and benefits of certain business undertakings. These assurances result in a more professional corporate culture, which in turn makes the business a more sensible and reliable vehicle for all types of potential investors.
Abstract
Description
MR=Prod*MSeas*QSeas*MQuota.
NHA=NProd*MSeas*QSeas*MQuota,
where Nprod is a measure of new hire productivity, the value of which depends on whether the new hire is a sales representative or a channel resource.
Claims (9)
Priority Applications (2)
| Application Number | Priority Date | Filing Date | Title |
|---|---|---|---|
| US11/056,040 US7945472B2 (en) | 2005-02-11 | 2005-02-11 | Business management tool |
| PCT/US2005/041136 WO2006088517A2 (en) | 2005-02-11 | 2005-11-14 | Business management tool |
Applications Claiming Priority (1)
| Application Number | Priority Date | Filing Date | Title |
|---|---|---|---|
| US11/056,040 US7945472B2 (en) | 2005-02-11 | 2005-02-11 | Business management tool |
Publications (2)
| Publication Number | Publication Date |
|---|---|
| US20060184414A1 US20060184414A1 (en) | 2006-08-17 |
| US7945472B2 true US7945472B2 (en) | 2011-05-17 |
Family
ID=36816770
Family Applications (1)
| Application Number | Title | Priority Date | Filing Date |
|---|---|---|---|
| US11/056,040 Expired - Fee Related US7945472B2 (en) | 2005-02-11 | 2005-02-11 | Business management tool |
Country Status (2)
| Country | Link |
|---|---|
| US (1) | US7945472B2 (en) |
| WO (1) | WO2006088517A2 (en) |
Cited By (10)
| Publication number | Priority date | Publication date | Assignee | Title |
|---|---|---|---|---|
| US20090319344A1 (en) * | 2008-06-18 | 2009-12-24 | Tepper Samuel R | Assessment of sales force personnel for improvement of sales performance |
| US20130166337A1 (en) * | 2011-12-26 | 2013-06-27 | John MacGregor | Analyzing visual representation of data |
| US20130246129A1 (en) * | 2012-03-19 | 2013-09-19 | International Business Machines Corporation | Discovery and realization of business measurement concepts |
| US20140067484A1 (en) * | 2006-12-28 | 2014-03-06 | Oracle Otc Subsidiary Llc | Predictive and profile learning sales automation analytics system and method |
| US20150278738A1 (en) * | 2014-04-01 | 2015-10-01 | Sap Ag | Operational Leading Indicator (OLI) Management Using In-Memory Database |
| US10388179B2 (en) | 2008-06-18 | 2019-08-20 | Accenture Global Solutions Limited | Analytics platform |
| US11004097B2 (en) | 2016-06-30 | 2021-05-11 | International Business Machines Corporation | Revenue prediction for a sales pipeline using optimized weights |
| US11080640B1 (en) * | 2020-02-05 | 2021-08-03 | Accenture Global Solutions Limited | Systems and methods for managing organizational structures |
| US11113705B2 (en) | 2014-05-27 | 2021-09-07 | International Business Machines Corporation | Business forecasting using predictive metadata |
| US11657360B2 (en) | 2019-03-27 | 2023-05-23 | Samsung Electronics Co., Ltd. | Floating factory, operating method of manufacturing service device, and integrated product management system including floating factory and manufacturing service device |
Families Citing this family (58)
| Publication number | Priority date | Publication date | Assignee | Title |
|---|---|---|---|---|
| US7801759B1 (en) | 2004-05-28 | 2010-09-21 | Sprint Communications Company L.P. | Concept selection tool and process |
| US7546285B1 (en) * | 2004-09-24 | 2009-06-09 | Sprint Communications Company L.P. | System and method for scoring development concepts |
| US20060212337A1 (en) * | 2005-03-16 | 2006-09-21 | International Business Machines Corporation | Method and system for automatic assignment of sales opportunities to human agents |
| US7516081B2 (en) * | 2005-04-29 | 2009-04-07 | International Business Machines Corporation | Adaptive estimation of gain and revenue |
| US20070244738A1 (en) * | 2006-04-12 | 2007-10-18 | Chowdhary Pawan R | System and method for applying predictive metric analysis for a business monitoring subsystem |
| US7962358B1 (en) * | 2006-11-06 | 2011-06-14 | Sprint Communications Company L.P. | Integrated project and staffing management |
| WO2008067618A1 (en) * | 2006-12-08 | 2008-06-12 | Crosssell Pty Ltd | Methods and systems for providing on-demand data and for analysing customer requirements |
| US20080167942A1 (en) * | 2007-01-07 | 2008-07-10 | International Business Machines Corporation | Periodic revenue forecasting for multiple levels of an enterprise using data from multiple sources |
| US8015043B2 (en) * | 2007-01-31 | 2011-09-06 | International Business Machines Corporation | Method and apparatus for workforce demand forecasting |
| US20080208667A1 (en) * | 2007-02-26 | 2008-08-28 | Gregg Lymbery | Method for multi-sourcing technology based services |
| US8239248B2 (en) * | 2007-03-07 | 2012-08-07 | Microsoft Corporation | Techniques to manage information for dynamic reports using time periods for a business model |
| US7852017B1 (en) * | 2007-03-12 | 2010-12-14 | Cirrus Logic, Inc. | Ballast for light emitting diode light sources |
| US8723438B2 (en) * | 2007-03-12 | 2014-05-13 | Cirrus Logic, Inc. | Switch power converter control with spread spectrum based electromagnetic interference reduction |
| US8076920B1 (en) | 2007-03-12 | 2011-12-13 | Cirrus Logic, Inc. | Switching power converter and control system |
| US7667408B2 (en) | 2007-03-12 | 2010-02-23 | Cirrus Logic, Inc. | Lighting system with lighting dimmer output mapping |
| US20080270200A1 (en) * | 2007-04-30 | 2008-10-30 | International Business Machines Corporation | System and methods for pandemic planning |
| US7554473B2 (en) | 2007-05-02 | 2009-06-30 | Cirrus Logic, Inc. | Control system using a nonlinear delta-sigma modulator with nonlinear process modeling |
| US20080281678A1 (en) * | 2007-05-09 | 2008-11-13 | Mclagan Partners, Inc. | Practice management analysis tool for financial advisors |
| US20090055382A1 (en) * | 2007-08-23 | 2009-02-26 | Sap Ag | Automatic Peer Group Formation for Benchmarking |
| US20100030610A1 (en) * | 2007-09-05 | 2010-02-04 | Ram Gomeh | Method and System for Controlling and Managing an Organization |
| US9294296B2 (en) * | 2007-10-31 | 2016-03-22 | Hewlett Packard Enterprise Development Lp | Automated test execution in a shared virtualized resource pool |
| US20100100401A1 (en) * | 2008-10-16 | 2010-04-22 | Jerome Rolia | System And Method For Sizing Enterprise Application Systems |
| US8576589B2 (en) | 2008-01-30 | 2013-11-05 | Cirrus Logic, Inc. | Switch state controller with a sense current generated operating voltage |
| US20090248489A1 (en) * | 2008-03-26 | 2009-10-01 | Moncreiff Craig T | System and method of market research business analysis |
| US8606623B1 (en) * | 2008-03-31 | 2013-12-10 | Knowledgepoint 360 Group, LLC | Organization and peer set metric for generating and displaying benchmarking information |
| US20090276259A1 (en) * | 2008-05-02 | 2009-11-05 | Karol Bliznak | Aggregating risk in an enterprise strategy and performance management system |
| ITTO20080434A1 (en) * | 2008-06-05 | 2009-12-06 | Accenture Global Services Gmbh | DATA COLLECTION AND ANALYSIS SYSTEM FOR CONSUMER PURCHASES AND BUYERS |
| US8344707B2 (en) * | 2008-07-25 | 2013-01-01 | Cirrus Logic, Inc. | Current sensing in a switching power converter |
| US8212491B2 (en) | 2008-07-25 | 2012-07-03 | Cirrus Logic, Inc. | Switching power converter control with triac-based leading edge dimmer compatibility |
| US8279628B2 (en) | 2008-07-25 | 2012-10-02 | Cirrus Logic, Inc. | Audible noise suppression in a resonant switching power converter |
| EP2172897A1 (en) * | 2008-09-25 | 2010-04-07 | Amadeus | Improvements in or relating to the management of e-tickets |
| US8222872B1 (en) | 2008-09-30 | 2012-07-17 | Cirrus Logic, Inc. | Switching power converter with selectable mode auxiliary power supply |
| US8288954B2 (en) | 2008-12-07 | 2012-10-16 | Cirrus Logic, Inc. | Primary-side based control of secondary-side current for a transformer |
| US8299722B2 (en) | 2008-12-12 | 2012-10-30 | Cirrus Logic, Inc. | Time division light output sensing and brightness adjustment for different spectra of light emitting diodes |
| US8362707B2 (en) | 2008-12-12 | 2013-01-29 | Cirrus Logic, Inc. | Light emitting diode based lighting system with time division ambient light feedback response |
| US8055493B2 (en) * | 2009-01-30 | 2011-11-08 | Hewlett-Packard Development Company, L.P. | Sizing an infrastructure configuration optimized for a workload mix using a predictive model |
| US8448181B2 (en) * | 2009-01-30 | 2013-05-21 | Hewlett-Packard Development Company, L.P. | Sizing an infrastructure configuration optimized for a workload mix |
| US8482223B2 (en) | 2009-04-30 | 2013-07-09 | Cirrus Logic, Inc. | Calibration of lamps |
| US8963535B1 (en) | 2009-06-30 | 2015-02-24 | Cirrus Logic, Inc. | Switch controlled current sensing using a hall effect sensor |
| US8248145B2 (en) | 2009-06-30 | 2012-08-21 | Cirrus Logic, Inc. | Cascode configured switching using at least one low breakdown voltage internal, integrated circuit switch to control at least one high breakdown voltage external switch |
| US8198874B2 (en) | 2009-06-30 | 2012-06-12 | Cirrus Logic, Inc. | Switching power converter with current sensing transformer auxiliary power supply |
| US8212493B2 (en) * | 2009-06-30 | 2012-07-03 | Cirrus Logic, Inc. | Low energy transfer mode for auxiliary power supply operation in a cascaded switching power converter |
| US20110066472A1 (en) * | 2009-09-17 | 2011-03-17 | Pedro Cabrera Scheider | Internet-Based Benchmarking System and Method for Evaluating and Comparing Businesses Using Metrics |
| US9155174B2 (en) | 2009-09-30 | 2015-10-06 | Cirrus Logic, Inc. | Phase control dimming compatible lighting systems |
| US9178415B1 (en) | 2009-10-15 | 2015-11-03 | Cirrus Logic, Inc. | Inductor over-current protection using a volt-second value representing an input voltage to a switching power converter |
| US8654483B2 (en) * | 2009-11-09 | 2014-02-18 | Cirrus Logic, Inc. | Power system having voltage-based monitoring for over current protection |
| US20110246340A1 (en) * | 2010-04-02 | 2011-10-06 | Tracelink, Inc. | Method and system for collaborative execution of business processes |
| US8569972B2 (en) | 2010-08-17 | 2013-10-29 | Cirrus Logic, Inc. | Dimmer output emulation |
| US8536799B1 (en) | 2010-07-30 | 2013-09-17 | Cirrus Logic, Inc. | Dimmer detection |
| US20120053995A1 (en) * | 2010-08-31 | 2012-03-01 | D Albis John | Analyzing performance and setting strategic targets |
| US20150242884A1 (en) * | 2010-12-13 | 2015-08-27 | David K. Goodman | Cross-vertical publisher and advertiser reporting |
| US20120203595A1 (en) * | 2011-02-09 | 2012-08-09 | VisionEdge Marketing | Computer Readable Medium, File Server System, and Method for Market Segment Analysis, Selection, and Investment |
| WO2012119030A2 (en) * | 2011-03-02 | 2012-09-07 | Kilpatrick Townsend & Stockton Llp | Methods and systems for determing risk associated with a requirements document |
| US20160140474A1 (en) * | 2014-11-18 | 2016-05-19 | Tenore Ltd. | System and method for automated project performance analysis and project success rate prediction |
| US10181982B2 (en) * | 2015-02-09 | 2019-01-15 | TUPL, Inc. | Distributed multi-data source performance management |
| CN108536835A (en) * | 2018-04-12 | 2018-09-14 | 南通大学 | Scientific data and financial data integrated management method and system |
| CN111724079A (en) * | 2020-06-29 | 2020-09-29 | 信阳农林学院 | Industry economic data management system based on big data |
| EP4075352A1 (en) * | 2021-04-16 | 2022-10-19 | Tata Consultancy Services Limited | Method and system for providing intellectual property adoption recommendations to an enterprise |
Citations (40)
| Publication number | Priority date | Publication date | Assignee | Title |
|---|---|---|---|---|
| US5446890A (en) | 1991-11-27 | 1995-08-29 | Hewlett-Packard Company | System for using subsets of rules applied to a database for updating and generating the rule knowledge base and forecasts of system demand |
| US5461699A (en) | 1993-10-25 | 1995-10-24 | International Business Machines Corporation | Forecasting using a neural network and a statistical forecast |
| US5712985A (en) | 1989-09-12 | 1998-01-27 | Lee; Michael D. | System and method for estimating business demand based on business influences |
| US5960415A (en) | 1995-12-22 | 1999-09-28 | Glw Software Pty. Limited | Forecasting control system and method |
| US6029139A (en) | 1998-01-28 | 2000-02-22 | Ncr Corporation | Method and apparatus for optimizing promotional sale of products based upon historical data |
| US6032125A (en) | 1996-11-07 | 2000-02-29 | Fujitsu Limited | Demand forecasting method, demand forecasting system, and recording medium |
| US6067525A (en) | 1995-10-30 | 2000-05-23 | Clear With Computers | Integrated computerized sales force automation system |
| US6078893A (en) | 1998-05-21 | 2000-06-20 | Khimetrics, Inc. | Method for stabilized tuning of demand models |
| US6094641A (en) | 1997-05-21 | 2000-07-25 | Khimetrics, Inc. | Method for incorporating psychological effects into demand models |
| US6119097A (en) | 1997-11-26 | 2000-09-12 | Executing The Numbers, Inc. | System and method for quantification of human performance factors |
| US6173310B1 (en) | 1999-03-23 | 2001-01-09 | Microstrategy, Inc. | System and method for automatic transmission of on-line analytical processing system report output |
| US6205431B1 (en) | 1998-10-29 | 2001-03-20 | Smart Software, Inc. | System and method for forecasting intermittent demand |
| US6219649B1 (en) | 1999-01-21 | 2001-04-17 | Joel Jameson | Methods and apparatus for allocating resources in the presence of uncertainty |
| US6263315B1 (en) | 1998-11-02 | 2001-07-17 | Pricing Research Corporation | Revenue management system and method |
| US6269393B1 (en) | 1999-03-23 | 2001-07-31 | Microstrategy, Inc. | System and method for automatic transmission of personalized OLAP report output |
| US6317700B1 (en) | 1999-12-22 | 2001-11-13 | Curtis A. Bagne | Computational method and system to perform empirical induction |
| US6321205B1 (en) | 1995-10-03 | 2001-11-20 | Value Miner, Inc. | Method of and system for modeling and analyzing business improvement programs |
| US6393406B1 (en) | 1995-10-03 | 2002-05-21 | Value Mines, Inc. | Method of and system for valving elements of a business enterprise |
| US6405208B1 (en) | 1999-12-13 | 2002-06-11 | Hyperion Solutions Corporation | Dynamic recursive build for multidimensional databases and methods and apparatus thereof |
| US20020099563A1 (en) * | 2001-01-19 | 2002-07-25 | Michael Adendorff | Data warehouse system |
| US20020133368A1 (en) * | 1999-10-28 | 2002-09-19 | David Strutt | Data warehouse model and methodology |
| US6473748B1 (en) | 1998-08-31 | 2002-10-29 | Worldcom, Inc. | System for implementing rules |
| US20030018506A1 (en) * | 2000-05-17 | 2003-01-23 | Mclean Robert I.G. | Data processing system and method for analysis of financial and non-financial value creation and value realization performance of a business enterprise for provisioning of real-time assurance reports |
| US20030033184A1 (en) | 2000-10-03 | 2003-02-13 | Moshe Benbassat | Method and system for assigning human resources to provide services |
| US6539392B1 (en) | 2000-03-29 | 2003-03-25 | Bizrate.Com | System and method for data collection, evaluation, information generation, and presentation |
| US20030074285A1 (en) | 2001-03-23 | 2003-04-17 | Restaurant Services, Inc. | System, method and computer program product for translating sales data in a supply chain management framework |
| US6567796B1 (en) | 1999-03-23 | 2003-05-20 | Microstrategy, Incorporated | System and method for management of an automatic OLAP report broadcast system |
| US6611726B1 (en) | 1999-09-17 | 2003-08-26 | Carl E. Crosswhite | Method for determining optimal time series forecasting parameters |
| US6665683B1 (en) | 2001-06-22 | 2003-12-16 | E. Intelligence, Inc. | System and method for adjusting a value within a multidimensional aggregation tree |
| US6708156B1 (en) | 2000-04-17 | 2004-03-16 | Michael Von Gonten, Inc. | System and method for projecting market penetration |
| US20040068431A1 (en) | 2002-10-07 | 2004-04-08 | Gartner, Inc. | Methods and systems for evaluation of business performance |
| US6738736B1 (en) * | 1999-10-06 | 2004-05-18 | Accenture Llp | Method and estimator for providing capacacity modeling and planning |
| US20040243459A1 (en) | 2003-01-24 | 2004-12-02 | Geritz William F. | System and method for automating business development |
| US20050065754A1 (en) * | 2002-12-20 | 2005-03-24 | Accenture Global Services Gmbh | Quantification of operational risks |
| US20050091156A1 (en) * | 2001-10-05 | 2005-04-28 | Accenture Global Services Gmbh | Customer relationship management |
| US20050119861A1 (en) * | 2003-08-06 | 2005-06-02 | Roman Bukary | Methods and systems for providing benchmark information under controlled access |
| US20050209945A1 (en) * | 2004-03-02 | 2005-09-22 | Ballow John J | Mapping total return to shareholder |
| US20060117303A1 (en) * | 2004-11-24 | 2006-06-01 | Gizinski Gerard H | Method of simplifying & automating enhanced optimized decision making under uncertainty |
| US7117161B2 (en) * | 2000-08-21 | 2006-10-03 | Bruce Elisa M | Decision dynamics |
| US20090018891A1 (en) * | 2003-12-30 | 2009-01-15 | Jeff Scott Eder | Market value matrix |
-
2005
- 2005-02-11 US US11/056,040 patent/US7945472B2/en not_active Expired - Fee Related
- 2005-11-14 WO PCT/US2005/041136 patent/WO2006088517A2/en active Application Filing
Patent Citations (42)
| Publication number | Priority date | Publication date | Assignee | Title |
|---|---|---|---|---|
| US5712985A (en) | 1989-09-12 | 1998-01-27 | Lee; Michael D. | System and method for estimating business demand based on business influences |
| US5446890A (en) | 1991-11-27 | 1995-08-29 | Hewlett-Packard Company | System for using subsets of rules applied to a database for updating and generating the rule knowledge base and forecasts of system demand |
| US5461699A (en) | 1993-10-25 | 1995-10-24 | International Business Machines Corporation | Forecasting using a neural network and a statistical forecast |
| US6393406B1 (en) | 1995-10-03 | 2002-05-21 | Value Mines, Inc. | Method of and system for valving elements of a business enterprise |
| US6321205B1 (en) | 1995-10-03 | 2001-11-20 | Value Miner, Inc. | Method of and system for modeling and analyzing business improvement programs |
| US6067525A (en) | 1995-10-30 | 2000-05-23 | Clear With Computers | Integrated computerized sales force automation system |
| US5960415A (en) | 1995-12-22 | 1999-09-28 | Glw Software Pty. Limited | Forecasting control system and method |
| US6032125A (en) | 1996-11-07 | 2000-02-29 | Fujitsu Limited | Demand forecasting method, demand forecasting system, and recording medium |
| US6094641A (en) | 1997-05-21 | 2000-07-25 | Khimetrics, Inc. | Method for incorporating psychological effects into demand models |
| US6119097A (en) | 1997-11-26 | 2000-09-12 | Executing The Numbers, Inc. | System and method for quantification of human performance factors |
| US6029139A (en) | 1998-01-28 | 2000-02-22 | Ncr Corporation | Method and apparatus for optimizing promotional sale of products based upon historical data |
| US6078893A (en) | 1998-05-21 | 2000-06-20 | Khimetrics, Inc. | Method for stabilized tuning of demand models |
| US6473748B1 (en) | 1998-08-31 | 2002-10-29 | Worldcom, Inc. | System for implementing rules |
| US6205431B1 (en) | 1998-10-29 | 2001-03-20 | Smart Software, Inc. | System and method for forecasting intermittent demand |
| US6263315B1 (en) | 1998-11-02 | 2001-07-17 | Pricing Research Corporation | Revenue management system and method |
| US6219649B1 (en) | 1999-01-21 | 2001-04-17 | Joel Jameson | Methods and apparatus for allocating resources in the presence of uncertainty |
| US6625577B1 (en) | 1999-01-21 | 2003-09-23 | Joel Jameson | Methods and apparatus for allocating resources in the presence of uncertainty |
| US6173310B1 (en) | 1999-03-23 | 2001-01-09 | Microstrategy, Inc. | System and method for automatic transmission of on-line analytical processing system report output |
| US6269393B1 (en) | 1999-03-23 | 2001-07-31 | Microstrategy, Inc. | System and method for automatic transmission of personalized OLAP report output |
| US6567796B1 (en) | 1999-03-23 | 2003-05-20 | Microstrategy, Incorporated | System and method for management of an automatic OLAP report broadcast system |
| US6611726B1 (en) | 1999-09-17 | 2003-08-26 | Carl E. Crosswhite | Method for determining optimal time series forecasting parameters |
| US6738736B1 (en) * | 1999-10-06 | 2004-05-18 | Accenture Llp | Method and estimator for providing capacacity modeling and planning |
| US20020133368A1 (en) * | 1999-10-28 | 2002-09-19 | David Strutt | Data warehouse model and methodology |
| US6405208B1 (en) | 1999-12-13 | 2002-06-11 | Hyperion Solutions Corporation | Dynamic recursive build for multidimensional databases and methods and apparatus thereof |
| US6317700B1 (en) | 1999-12-22 | 2001-11-13 | Curtis A. Bagne | Computational method and system to perform empirical induction |
| US6539392B1 (en) | 2000-03-29 | 2003-03-25 | Bizrate.Com | System and method for data collection, evaluation, information generation, and presentation |
| US6708156B1 (en) | 2000-04-17 | 2004-03-16 | Michael Von Gonten, Inc. | System and method for projecting market penetration |
| US20030018506A1 (en) * | 2000-05-17 | 2003-01-23 | Mclean Robert I.G. | Data processing system and method for analysis of financial and non-financial value creation and value realization performance of a business enterprise for provisioning of real-time assurance reports |
| US7386466B2 (en) * | 2000-05-17 | 2008-06-10 | Tvc International Inc. | Continuously updated data processing system and method for measuring and reporting on value creation performance that supports real-time benchmarking |
| US7117161B2 (en) * | 2000-08-21 | 2006-10-03 | Bruce Elisa M | Decision dynamics |
| US20030033184A1 (en) | 2000-10-03 | 2003-02-13 | Moshe Benbassat | Method and system for assigning human resources to provide services |
| US20020099563A1 (en) * | 2001-01-19 | 2002-07-25 | Michael Adendorff | Data warehouse system |
| US20030074285A1 (en) | 2001-03-23 | 2003-04-17 | Restaurant Services, Inc. | System, method and computer program product for translating sales data in a supply chain management framework |
| US6665683B1 (en) | 2001-06-22 | 2003-12-16 | E. Intelligence, Inc. | System and method for adjusting a value within a multidimensional aggregation tree |
| US20050091156A1 (en) * | 2001-10-05 | 2005-04-28 | Accenture Global Services Gmbh | Customer relationship management |
| US20040068431A1 (en) | 2002-10-07 | 2004-04-08 | Gartner, Inc. | Methods and systems for evaluation of business performance |
| US20050065754A1 (en) * | 2002-12-20 | 2005-03-24 | Accenture Global Services Gmbh | Quantification of operational risks |
| US20040243459A1 (en) | 2003-01-24 | 2004-12-02 | Geritz William F. | System and method for automating business development |
| US20050119861A1 (en) * | 2003-08-06 | 2005-06-02 | Roman Bukary | Methods and systems for providing benchmark information under controlled access |
| US20090018891A1 (en) * | 2003-12-30 | 2009-01-15 | Jeff Scott Eder | Market value matrix |
| US20050209945A1 (en) * | 2004-03-02 | 2005-09-22 | Ballow John J | Mapping total return to shareholder |
| US20060117303A1 (en) * | 2004-11-24 | 2006-06-01 | Gizinski Gerard H | Method of simplifying & automating enhanced optimized decision making under uncertainty |
Cited By (14)
| Publication number | Priority date | Publication date | Assignee | Title |
|---|---|---|---|---|
| US20140067484A1 (en) * | 2006-12-28 | 2014-03-06 | Oracle Otc Subsidiary Llc | Predictive and profile learning sales automation analytics system and method |
| US10388179B2 (en) | 2008-06-18 | 2019-08-20 | Accenture Global Solutions Limited | Analytics platform |
| US20090319344A1 (en) * | 2008-06-18 | 2009-12-24 | Tepper Samuel R | Assessment of sales force personnel for improvement of sales performance |
| US20130166337A1 (en) * | 2011-12-26 | 2013-06-27 | John MacGregor | Analyzing visual representation of data |
| US20130246129A1 (en) * | 2012-03-19 | 2013-09-19 | International Business Machines Corporation | Discovery and realization of business measurement concepts |
| US10546252B2 (en) * | 2012-03-19 | 2020-01-28 | International Business Machines Corporation | Discovery and generation of organizational key performance indicators utilizing glossary repositories |
| US11295247B2 (en) | 2012-03-19 | 2022-04-05 | International Business Machines Corporation | Discovery and generation of organizational key performance indicators utilizing glossary repositories |
| US20150278738A1 (en) * | 2014-04-01 | 2015-10-01 | Sap Ag | Operational Leading Indicator (OLI) Management Using In-Memory Database |
| US9619769B2 (en) * | 2014-04-01 | 2017-04-11 | Sap Se | Operational leading indicator (OLI) management using in-memory database |
| US11113705B2 (en) | 2014-05-27 | 2021-09-07 | International Business Machines Corporation | Business forecasting using predictive metadata |
| US11004097B2 (en) | 2016-06-30 | 2021-05-11 | International Business Machines Corporation | Revenue prediction for a sales pipeline using optimized weights |
| US11657360B2 (en) | 2019-03-27 | 2023-05-23 | Samsung Electronics Co., Ltd. | Floating factory, operating method of manufacturing service device, and integrated product management system including floating factory and manufacturing service device |
| US11080640B1 (en) * | 2020-02-05 | 2021-08-03 | Accenture Global Solutions Limited | Systems and methods for managing organizational structures |
| US11556878B2 (en) | 2020-02-05 | 2023-01-17 | Accenture Global Solutions Limited | Systems and methods for managing organizational structures |
Also Published As
| Publication number | Publication date |
|---|---|
| US20060184414A1 (en) | 2006-08-17 |
| WO2006088517A2 (en) | 2006-08-24 |
| WO2006088517A3 (en) | 2007-09-07 |
Similar Documents
| Publication | Publication Date | Title |
|---|---|---|
| US7945472B2 (en) | Business management tool | |
| Hilorme et al. | Formation of risk mitigating strategies for the implementation of projects of energy saving technologies | |
| US7930195B2 (en) | Strategic management and budgeting tools | |
| US20110173050A1 (en) | Strategic Planning And Valuation | |
| US20040073467A1 (en) | Software tools and method for business planning | |
| US20040073477A1 (en) | Shareholder value enhancement | |
| US20120059680A1 (en) | Systems and Methods for Facilitating Information Technology Assessments | |
| US20140149175A1 (en) | Financial Risk Analytics for Service Contracts | |
| US20130226830A1 (en) | System and method for transactional risk and return analysis | |
| Maya et al. | Develop an artificial neural network (ANN) model to predict construction projects performance in Syria | |
| AU2010257410B2 (en) | Marketing investment optimizer with dynamic hierarchies | |
| Iliemena et al. | Effect of standard costing on profitability of manufacturing companies: Study of Edo State Nigeria | |
| Rafke et al. | Simulating fleet procurement in an Indonesian logistics company | |
| Lutilsky et al. | Cost planning and controlin Croatian public sector | |
| Abuzyarova | Methodological approaches to ensure the competitiveness of organizations | |
| Jarrett | An approach to cost—volume—profit analysis under uncertainty | |
| Kee et al. | Decision control of products developed using target costing | |
| US8606616B1 (en) | Selection of business success indicators based on scoring of intended program results, assumptions or dependencies, and projects | |
| Ye et al. | 4PL suppliers evaluating indicator system based on Grey Correlation Model | |
| Țurcanu | The impact of software activity on the implementation of cost managerial system | |
| Patil et al. | Maturity of cost management systems in organisations | |
| Cedergren et al. | Towards integrating perceived customer value in the evaluation of performance in product development | |
| KR20230033191A (en) | Credit rating method using weather and calendar data | |
| Locher et al. | Towards risk adjusted controlling of strategic IS projects in banks in the light of Basel II | |
| US20120185405A1 (en) | Method and apparatus for commodity sourcing management |
Legal Events
| Date | Code | Title | Description |
|---|---|---|---|
| AS | Assignment |
Owner name: OPTIMUM OUTCOMES, LLC, NEW HAMPSHIRE Free format text: ASSIGNMENT OF ASSIGNORS INTEREST;ASSIGNORS:PAPPAS, GEORGE;CANNON, JAMES;REEL/FRAME:016618/0971 Effective date: 20050512 |
|
| STCF | Information on status: patent grant |
Free format text: PATENTED CASE |
|
| AS | Assignment |
Owner name: OPTIMUM OUTCOMES, INC., NEW HAMPSHIRE Free format text: CORRECTIVE ASSIGNMENT TO CORRECT THE NAME OF THE RECEIVING PARTY (OPTIMUM OUTCOMES, LLC) TO OPTIMUM OUTCOMES, INC. PREVIOUSLY RECORDED ON REEL 016618 FRAME 0972. ASSIGNOR(S) HEREBY CONFIRMS THE CHANGE IN NAME OF RECEIVING PARTY TO OPTIMUM OUTCOMES, INC.;ASSIGNORS:PAPPAS, GEORGE;CANNON, JAMES;SIGNING DATES FROM 20130323 TO 20130326;REEL/FRAME:030202/0784 Owner name: OPTIMUM OUTCOME, INC., NEW HAMPSHIRE Free format text: CHANGE OF NAME;ASSIGNOR:OPTIMUM OUTCOMES, INC.;REEL/FRAME:030202/0789 Effective date: 20130112 Owner name: SALESOPS ANALYTICS LLC, NEW HAMPSHIRE Free format text: ASSIGNMENT OF ASSIGNORS INTEREST;ASSIGNOR:OPTIMUM OUTCOME, INC.;REEL/FRAME:030195/0558 Effective date: 20130405 |
|
| FPAY | Fee payment |
Year of fee payment: 4 |
|
| AS | Assignment |
Owner name: CANNON, JAMES, NEW HAMPSHIRE Free format text: NUNC PRO TUNC ASSIGNMENT;ASSIGNOR:SALESOPS ANALYTICS;REEL/FRAME:042211/0567 Effective date: 20170301 Owner name: PAPPAS, GEORGE, VIRGINIA Free format text: NUNC PRO TUNC ASSIGNMENT;ASSIGNOR:SALESOPS ANALYTICS;REEL/FRAME:042211/0567 Effective date: 20170301 |
|
| FEPP | Fee payment procedure |
Free format text: MAINTENANCE FEE REMINDER MAILED (ORIGINAL EVENT CODE: REM.); ENTITY STATUS OF PATENT OWNER: SMALL ENTITY |
|
| FEPP | Fee payment procedure |
Free format text: 7.5 YR SURCHARGE - LATE PMT W/IN 6 MO, SMALL ENTITY (ORIGINAL EVENT CODE: M2555); ENTITY STATUS OF PATENT OWNER: SMALL ENTITY |
|
| MAFP | Maintenance fee payment |
Free format text: PAYMENT OF MAINTENANCE FEE, 8TH YR, SMALL ENTITY (ORIGINAL EVENT CODE: M2552); ENTITY STATUS OF PATENT OWNER: SMALL ENTITY Year of fee payment: 8 |
|
| FEPP | Fee payment procedure |
Free format text: MAINTENANCE FEE REMINDER MAILED (ORIGINAL EVENT CODE: REM.); ENTITY STATUS OF PATENT OWNER: SMALL ENTITY |
|
| LAPS | Lapse for failure to pay maintenance fees |
Free format text: PATENT EXPIRED FOR FAILURE TO PAY MAINTENANCE FEES (ORIGINAL EVENT CODE: EXP.); ENTITY STATUS OF PATENT OWNER: SMALL ENTITY |
|
| STCH | Information on status: patent discontinuation |
Free format text: PATENT EXPIRED DUE TO NONPAYMENT OF MAINTENANCE FEES UNDER 37 CFR 1.362 |
|
| FP | Lapsed due to failure to pay maintenance fee |
Effective date: 20230517 |