US7904512B2 - Methods and systems for computer based collaboration - Google Patents
Methods and systems for computer based collaboration Download PDFInfo
- Publication number
- US7904512B2 US7904512B2 US11/119,636 US11963605A US7904512B2 US 7904512 B2 US7904512 B2 US 7904512B2 US 11963605 A US11963605 A US 11963605A US 7904512 B2 US7904512 B2 US 7904512B2
- Authority
- US
- United States
- Prior art keywords
- words
- relations
- identified
- data
- participants
- Prior art date
- Legal status (The legal status is an assumption and is not a legal conclusion. Google has not performed a legal analysis and makes no representation as to the accuracy of the status listed.)
- Expired - Fee Related, expires
Links
Images


Classifications
-
- G—PHYSICS
- G06—COMPUTING; CALCULATING OR COUNTING
- G06Q—INFORMATION AND COMMUNICATION TECHNOLOGY [ICT] SPECIALLY ADAPTED FOR ADMINISTRATIVE, COMMERCIAL, FINANCIAL, MANAGERIAL OR SUPERVISORY PURPOSES; SYSTEMS OR METHODS SPECIALLY ADAPTED FOR ADMINISTRATIVE, COMMERCIAL, FINANCIAL, MANAGERIAL OR SUPERVISORY PURPOSES, NOT OTHERWISE PROVIDED FOR
- G06Q10/00—Administration; Management
- G06Q10/10—Office automation; Time management
-
- G—PHYSICS
- G06—COMPUTING; CALCULATING OR COUNTING
- G06F—ELECTRIC DIGITAL DATA PROCESSING
- G06F40/00—Handling natural language data
- G06F40/20—Natural language analysis
- G06F40/237—Lexical tools
Definitions
- the present invention is related to methods, systems and program products for computer based collaboration.
- the present invention includes methods, computer program products, and systems for computer based collaboration.
- An exemplary method for computer based collaboration between a plurality of participants communicating over a data network comprises the steps of receiving communications data, using a text analysis tool to identify at least a plurality of k-words from the communications data and a plurality of relations linking at least a portion of the plurality of k-words, and displaying the k-words and relations to the plurality of participants over the computer network.
- FIG. 1 is a schematic of a computer network useful to illustrate practice of methods and systems of the invention
- FIG. 2 is a flowchart of one embodiment of a method of the invention
- FIG. 3 is an exemplary Keygraph
- FIG. 4 is a flowchart showing exemplary steps of applying a genetic algorithm
- FIG. 5 is a flowchart of an additional method of the invention.
- FIG. 6 illustrates a screen displayed through practice of one embodiment of the invention
- FIG. 7 illustrates an additional screen displayed through practice of an embodiment of the invention
- FIG. 8 illustrates an additional screen displayed through practice of an embodiment of the invention
- FIG. 9 illustrates an additional screen displayed through practice of an embodiment of the invention.
- FIG. 10 illustrates an additional screen displayed through practice of an embodiment of the invention
- FIG. 11 is a flowchart of an additional exemplary method of the invention.
- FIG. 12 is a flowchart of an additional exemplary method of the invention.
- a method of the invention may be carried out by one or more users using computers, and a program product of the invention may include computer executable instructions that when executed by one or more computers cause one or more computers to carry out a method of the invention.
- a program product of the invention may include computer executable instructions that when executed by one or more computers cause one or more computers to carry out a method of the invention.
- one or more computers that are executing a program product of the invention may embody a system of the invention. It will therefore be appreciated that in describing a particular embodiment of the present invention, description of other embodiments may also be made. For example, it will be understood that when describing a method of the invention, a system and/or a program product of the invention may likewise be described.
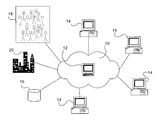
- FIG. 1 is a schematic of an exemplary data network that may be useful for practice of embodiments of the invention.
- the network 10 includes at least one computer 12 , and is connected to a plurality of computers 14 .
- the computers may be used by participants such as individuals or groups, or the like.
- the computers 14 may be referred to as participants 14 to indicate that one or more people are using the computers 14 to communicate with the network 10 .
- the computers 14 are intended to broadly represent processor based devices useful to communicate with the network 10 , and may be by way of example phones, personal digital assistants, handheld processor based devices, and the like.
- the network 10 may be any suitable communications network, with examples including a digital data network, a PSTN, a digital phone network, a wireless network, or a combination of one or more of these.
- the network 10 may be, for instance, the Internet.
- the network 10 is useful to communicate digital data, and may be using a packet-based protocol such as internet protocol to operate.
- the participants 14 may communicate with the network 10 and the computer 12 via wired or wireless connections as are generally known.
- the network 10 may also be connected to one or more data storage mediums 16 , which may be a computer, a memory device, or the like.
- the network 10 is also preferably linked for communicating with one or more individuals that have been collectively illustrated as the plurality of individuals 18 .
- the network is also connected to other outside real-world sources that have collectively been illustrated for convenience as the “city” 20 .
- the individuals 18 are intended to broadly represent any people that are able to be communicated with over the network 10 . They may be, for example, a plurality of centralized or distributed customers, employees, survey participants, experts in a particular field, students, focus groups, or the like.
- the city 20 is intended to broadly represent real-world data sources, which may include for example media such as radio, TV, newspaper, wire sources, and periodicals; government agencies; trade groups; and the like.
- a method for computer based collaboration of the invention may include, for example, the participants 14 communicating with one another over the network 10 to share ideas or to solve a problem. This may take the form of the participants 14 sharing text messages that are received by the computer 12 and displayed over the network 10 with all of the participants 14 .
- inventions may involve the participants 14 collaborating to analyze or otherwise discuss data that is being communicated over the network 10 .
- Incoming data from the real world 20 may describe one or more events occurring in substantially real time, which may be analyzed by the participants 14 through collaborative communication over the network 10 .
- data may be communicated from the real world 20 describing the unfolding event, and the participants 14 may collaboratively communicate to analyze the incoming real world data and make predictions regarding how it will proceed.
- communications data is received at the computer 12 from one of the participants 14 .
- the communications data may be, for example, text data typed in at a keyboard by any of the participants 14 .
- the communications data may be in other forms, with speech being an example. Speech may be input into telephones or microphones connected to a participant's 14 computer that is then converted to text. In this manner, methods of the invention may be practiced during phone or video conferences between participants 14 .
- the exemplary method of FIG. 2 next includes a step of using a text analysis tool to analyze the communications data to identify k-words and relations.
- k-word is intended to be broadly interpreted as a word, phrase of two or more words, symbol or other non-alphabetic character, or the like from the communications data that summarizes a meaningful aspect of the data. That is, a k-word summarizes or gives an indication of the meaning of a passage in which it occurs. A passage of multiple words may be more briefly summarized through only a few k-words.
- K-words may be identified, for example, based on statistical significance.
- “Mary” and “fruit” each occur twice and are therefore statistically significant.
- the term “relation” is intended to be broadly interpreted as meaning a logical connection.
- a relation may exist between the k-words “mary” and “bought,” and between the k-words “fruit” and “bought.” Relations may be identified through statistical and other methods. With reference to the simplistic example above, for instance, the proximity in the original text of the k-words “Mary” and “fruit” may suggest that there is a relation between the two.
- k-words may alternately be referred to as “keywords.”
- Exemplary invention embodiments discussed herein, however, may include use of Keygraphs as text analysis tools.
- the term “keyword” has a specific meaning within Keygraphs, so for clarity herein the term “k-word” is used in the scope of the larger invention and the term “keyword” is limited to its specific meaning within a Keygraph.
- text analysis tool is intended to be broadly interpreted as meaning a tool or a method that may be embodied in computer code for analyzing data to identify k-words and relations.
- text analysis tools suitable for use in methods and program products of the invention. Examples include numerical, statistical, adaptive optimization, heuristic, artificial intelligence and language processing methods useful to perceive frequencies, patterns, sequences, regularities and other features of text data.
- Many useful text analysis tools employ statistical analysis to identify the frequency of occurrence of words or phrases in a given text. Words or phrases that occur more frequently are concluded to have a higher probability of being relevant to the subject matter, and are identified as k-words. Metrics may be applied, such defining k-words as some portion (e.g., the top X %) of the most frequently appearing words or terms in the communications.
- text analysis tools are not limited to use with analyzing purely textual data. They may be used to identify, for instance, non-textual k-words such as numbers or non-alphabetic symbols that are used in a textual manner. Symbols or numbers, for instance, may be used in place of words within a text passage or to identify locations on a map or visual image. Text analysis tools may identify these numbers or non-alphabetic symbols of significance. A particular example may be the identification of common image features (k-words) from communications data comprising a plurality of photographic images.
- Some text analysis tools also analyze word or term placement or position in the communications data to identify relevance and/or relations between words or phrases. For example, words or phrases that are found to occur in a high frequency closely proximate to one another may be concluded to have a higher probability of being related to one another, thereby suggesting a relation.
- the positional closeness of the words to one another in the communications data may be useful to identify a relation.
- Relations between k-words could be identified, for instance, linking k-words that appear adjacent to one another, within some number X of words to one another, within the same sentence, within sequential sentences, within the same paragraph, etc. Relative placement or positional closeness of k-words may also be useful to estimate relative strength of the relation.
- Text analysis tools may also employ filters to filter out words not likely to be relevant (e.g., filter out all pronouns, prepositions, etc.), may use grammatical analysis to identify nouns and verbs, and perform other similar steps. Some text analysis tools are directed to identifying the underlying meaning of text through semantic analysis or other steps.
- chance discovery is intended to be broadly interpreted as meaning identifying a k-word and/or relation through means other than high frequency of occurrence. Put another way, chance discovery does not rely only on statistical significance alone.
- a chance discovery can be, for example, an event or a situation with significant impact on human decision making.
- Chance discovery can lead to an awareness of and explanation of the significance of a chance, especially if the chance is rare and its significance has been unnoticed. In other words, chance discovery can be used to provide means for inventing or surviving in the future, rather than predicting the future.
- Steps of chance discovery can include identifying k-words that occur with a low frequency in text but have a relatively high probability of being important.
- a step of chance discovery may include identifying a k-word that although it fails to meet the statistical cut-off for otherwise identifying k-words (e.g., not in the top X % of frequency), it is discovered that each of the few instances that the k-word appears are closely proximate to one or more high frequency k-words. Random selection of low frequency words or phrases is another example step of performing chance discovery.
- the graphical format may include, for instance, graphs such as bar graphs and the like, charts such as pie charts and the like, diagrams such as logic diagrams and the like, as well as any other suitable graphical format.
- the graphical display illustrates k-words as nodes and relations as links that connect relevant k-word nodes to one another.
- the graphical format attaches significance to the relative spatial position of the k-words on the graph.
- Other embodiments of the invention may display k-words and relations in formats other than a graphical one, with an example being an outline format.
- steps of using text analysis tools to identify k-words and relations are useful to look beneath the surface of text data. Subtle and not otherwise readily apparent concepts can come to light. Also, steps of employing chance discovery in the identification of k-words and relations can be particularly useful in some applications to identify rare but relevant k-words and relations to understand points of view that are otherwise not easily discerned from the text.
- k-words and relations are displayed as nodes and relations as lines linking nodes to one another.
- Keygraph may be used to describe a particular format of graphical display in which, as well as to describe the steps used to produce the output graphical display from the input data. For example, applying a Keygraph analysis to a set of data results in the output Keygraph.
- FIG. 3 is an example Keygraph produced through a Keygraph analysis of a relatively small set of data related to Japanese breakfast consumption. K-words are displayed as nodes with links between the nodes representing relations. In the graph, two major clusters emerge, corresponding to the Japanese tendency to eat both traditional Japanese and Western-style breakfast meals. Chance discovery identified the “vitamins” k-word. If this Keygraph was presented to a focus group of Japanese consumers, the focus group might immediately recognize the two clusters, but puzzle over the presence of the “vitamins” node in one of the clusters.
- Vitamin supplements are not a staple of the Japanese diet, but the focus group also perceived that the increased Westernization of the Japanese diet was upsetting the balance and healthfulness of that diet and that “vitamins” might be a response by a certain small number of consumers to try to restore balance and health. Users of the Keygraph such as marketing analysts might recognize “vitamins” as a marketing opportunity for vitamin supplements and vitamin fortified foods.
- a document D is composed of sentences and each sentence is composed of words.
- the document D is preprocessed in two steps:
- Low-frequency terms link clusters of high frequency terms to one another, and may be referred to as “keywords” or “key terms.”
- Two kinds or relations are identified: “links,” and “key links.” Links connect high-frequency terms to one another, and key-links connect low frequency terms (keywords) to high frequency terms.
- Key-links may be displayed on a Keygraph using a dashed line, and links using a solid line. Also, either of low or high frequency terms may be identified as “keywords” within the following keygraph analysis depending on the links and key-links connected to that term. Keywords connect clusters of terms to one another.
- High-frequency terms are first extracted. Terms in D′ are sorted by their frequency of occurrence and top nodes of high-frequency terms are retained. These high-frequency terms may be later be represented as nodes in a graph G. A set of the high-frequency terms is denoted by N HF .
- Links are then extracted. Statistically, a link may be thought of as representing co-occurrence-term-pairs that often occur in the same sentence.
- a measure for co-occurrence of terms w i and w j is defined as:
- assoc ⁇ ( w i , w j ) ⁇ s ⁇ D ⁇ min ⁇ ( ⁇ w i ⁇ s , ⁇ w j ⁇ s )
- w i and w j are elements of the set N HF
- s is the number of times a term w i occurs in a sentence s.
- the assoc values are computed for all pairs of high-frequency terms in N HF .
- the term-pairs are sorted according to their assoc values and the top N HF ⁇ 1 tightly associated term-pairs are taken to be the links.
- the relations between term-pairs are represented by the edges in G.
- key(w) gives a measure of how often a term w occurs near a cluster of high-frequency terms.
- the key values are computed for all the terms in D, and n key top key terms are taken as high-key terms. These high-key terms are added as to the output graph G as nodes (if they are not already present) and are elements of a set K HK .
- Key links are then extracted. For each high-frequency term w i ⁇ N HF and each high-key term w j ⁇ K HK , the assoc(w i ; w j ) is calculated. Links touching w j are sorted by their assoc values for each high-key term w j ⁇ K HK . A link with highest assoc values connecting w j to two or more clusters is chosen as a key link. Key links are represented by edges (if they are not already present) in the output graph G.
- Extracting Keywords Either of high or low frequency terms may be identified as keywords depending on the links and key-links connected to it. Keywords link clusters of terms to one another. To extract keywords, nodes in G are sorted by the sum of assoc values associated with the key links touching them. Terms represented by nodes of higher values of these sums than a certain threshold are extracted as keywords for the document D.
- exemplary methods, program products and systems of the invention are useful to perform computer based collaborations.
- steps of the invention collaboration participants are able to communicate between one another, and to view a graphical summary of their shared communications that keeps the collaboration focused and provides direction for advancing it.
- Embodiments of the invention may include additional steps to further the collaboration, and to, for instance, identify suitable solutions to a problem being collaboratively discussed.
- Exemplary steps include using tools such as genetic algorithms, knowledge management tools, modeling tools, predictive tools, and the like.
- the flowchart of FIG. 2 illustrates some exemplary additional steps.
- the participants 14 may use the displayed k-words and relations to develop one or more candidate solutions to a problem. (block 36 ).
- the candidate solution(s) may then be communicated over the network 10 to the group of individuals 18 for evaluation.
- the individuals 18 may be a consumer focus group, for example, whose opinions may be asked of a proposed new product.
- the individuals may be provided with individual computers or other devices in communication with the network 10 for communicating their evaluation so that the evaluation can be viewed in substantially real time by the participants 14 over the network 10 .
- the participants may continue to communicate with one another and further evolve solutions based on the continuous feedback of the individuals 18 .
- the collaboration may continue until a suitable solution is identified.
- steps of using a genetic operator can provide benefits and advantages in combination with other steps of the invention.
- steps of formulating a solution (block 36 ) and evaluating it (block 38 ) may benefit through use of a genetic operator to evolve a satisfactory solution over several iterations.
- solution set is intended to be broadly interpreted as including one or more solutions.
- solution is likewise intended to be broadly interpreted. Examples of “solutions” include proposals to solve a problem, textual expressions of ideas, product designs, terms, images, symbols, and the like.
- FIG. 4 is a flowchart illustrating one set of exemplary steps of applying a genetic operator that will be useful in practice of embodiments of the invention.
- a solution set is initially created. (block 42 ).
- the step of initially creating a solution set may comprise, for example, the participants 14 formulating solutions using k-words and relations discovered through a Keygraph.
- the solution set is then evaluated. (block 44 ). This may comprise, for instance, communicating the solution set over the network 10 to the individuals 18 ( FIG. 1 ) for subjective evaluation (e.g., “which solutions are ‘good,’ which are ‘bad,’ which is ‘best,’ which is ‘worst’”?).
- the individuals may be, for instance, a focus group using computers connected to the network 10 over which they view the solutions and input their evaluations.
- the step of evaluating the solutions (block 44 ) may also comprise submitting the solution set to a computer (with the computer 12 or any of the participant computers 14 being examples) for application of an objective scoring metric (e.g., score using measuring criteria on a scale of 1-100).
- a final solution has been evolved and the process is stopped.
- the final criteria may be subjective or objective. Exemplary subjective evaluation criteria may simply be that the solution(s) or some proportion of a solution set has been evaluated as “good,” while an exemplary objective criterion is that the solution or some proportion of a solution set has been evaluated to have a numerical score above some threshold.
- a genetic operator is applied to generate a new solution set. (block 50 ). Exemplary genetic operators include crossover, mutation, replacement, or other like operators for estimating and sampling a probability distribution and the like. Through application of a mutation operator, for instance, one solution might mutate into a different form.
- crossover operator might replace sub-parts (“genes”) of one solution (“chromosome”) with those of another. Replacement might replace a low scoring solution with a high scoring one. Iterations of evaluation and application of a genetic operator are then repeated until the completion criteria are satisfied. (blocks 44 - 50 ).
- steps of FIG. 4 are exemplary only, and many additional and equivalent steps may be performed. For example, prior to application of a genetic operator, it may be useful to remove the lowest scoring of the solutions from the solution set. Also, the sequence of the steps of FIG. 4 can be altered. Also, it will be appreciated that steps of evolving an improving solution in methods, systems and program products of the invention are not limited to use of a genetic operator.
- the steps of FIG. 4 may be performed by one or more of the participants 14 , other individuals, and/or by computers such as the computers 12 or 14 .
- the step of formulating a solution set (block 42 ) may be performed by a participant(s) 14 , the individuals 18 , or by a computer 12 or 14 .
- the steps of determining whether completion criteria have been satisfied (block 46 ) and of applying a genetic operator (block 50 ) may be performed by a participant(s) 14 or the individuals 18 using k-words and relations identified through steps of the invention. Or, those k-words and relations may be used by a computer 12 to formulate one or more solutions.
- one or more of the participants 14 or individuals 18 can apply a genetic operator to these solutions to evolve a new solution set. This new solution set may be evaluated by the participants 14 , the individuals 18 , or a computer 12 to identify promising new solutions.
- methods and program products of the invention may also include one or more steps of using data mining or text analysis tools to interpret and process data from the data storage medium 16 , the real-world sources 20 , and/or the individuals 18 .
- data mining is intended to be broadly interpreted as including methods for analyzing data using statistical or other means to summarize the content of data, or to identify correlations, patterns, sequences, regularities, develop models including predictive models, and the like.
- One of the participants 14 may perform a step of data mining to further explore issues surrounding one or more k-words identified during collaborative discussion.
- Exemplary methods, program products and systems of the invention may be useful with applications such as computer message boards or computer bulletin boards.
- Message or bulletin boards practiced through embodiments of the present invention include many steps heretofore unknown and provide many benefits and advantages not previously available.
- FIG. 5 is a flowchart illustrating an exemplary invention embodiment for computer based collaboration that may be used in a computer message or bulleting board application.
- the steps of FIG. 5 may be carried out by one or more computers connected to the network 10 , with the computer 12 being an example. Communications are received from one of the participants 14 (block 102 ) and are displayed (block 104 ). This may include, for example, a discrete text message being input from one of the participant computers 14 , received by the computer 12 running a program product of the invention, and displayed over the network 10 for viewing by any or all of the participants 14 .
- the method of FIG. 5 proceeds to determine whether a search command (block 106 ) or a graph command (block 108 ) has been received. If not, the method loops to receive additional discrete text messages from the same or others of the participants 14 .
- Discrete messages may be sent as a reply to one or more previous messages, and may be displayed in a format that indicates their relation to one another, with exemplary formats including as organized groups and as threads of discrete messages.
- the participants 14 may collaborate with one another over the network 10 to share ideas, strategies, or suggestions for a wide variety of purposes.
- the participants 14 may collaborate to solve a particular problem that has been presented to them. Collaboration may occur in real-time with the participants 14 talking or writing to one another “live,” or may occur over a more prolonged time with individual participants 14 picking up the discussion at different times as their respective schedules allow.
- a step of searching a selected term or phrase may be performed (block 110 ).
- the term may be selected through highlighting with a culsor, may be manually entered through typing, or can be selected through other steps.
- search is intended to be broadly interpreted as meaning using a search term to identify relevant information. It will be appreciated that a wide variety of searches can be performed, using a wide variety of information sources.
- a search may be performed, for example, of any data capable of being stored on the storage device 16 .
- Examples include a dictionary, treatise, technical reference, literature, database, survey results, catalogs, or the like.
- the search may be performed by searching the World Wide Web (or source available thereon) or other secondary network that may be connected to the network 10 . These secondary networks may provide access to a wide variety of information sources. Data sources available from the real world 20 may likewise be accessed for searching.
- results of the search are displayed (block 112 ). The display may be made over the network 10 for viewing by all of the participants 14 . Search results may be displayed by a priority ranking, and may include hyperlinks or other access to further information whereby a participant can quickly access further information if desired.
- the method of FIG. 5 further includes a step of determining whether a “graph command” has been received (block 108 ). If not, the method loops back to block 102 to receive additional communications. If a graph command has been received, a step of analyzing a text message to identify k-words and relations is performed. (block 114 ). The k-words and relations may be identified using one or more text analysis tools, and are preferably identified using a Keygraph analysis. The identified k-words and relations from one or more of the discrete text messages are then displayed in a graphical format (block 116 ). Preferably, the graphical display illustrates k-words as linked to one another by links that represent relations. A preferred graphical display is a Keygraph.
- each discrete message 122 may have been input by one of the participants 14 , and as illustrated may be displayed in a hierarchical (e.g., indentation used to represent relation to above message) or other organized format that makes clear which message 122 has been communicated in response to which previous message 122 .
- a hierarchical e.g., indentation used to represent relation to above message
- the “Sr” button 124 displayed on the screen 120 may be selected by a user using a mouse, keyboard or the like to generate a search command. ( FIG. 5 , blocks 106 , 110 and 112 ). A k-word or other word or phrase may be selected by highlighting, entering, or the like in combination with selecting the Sr button to identify the term to be searched. Selection of the displayed graph button “Gr” 126 using a keyboard, mouse or other selector can cause the graph command to be generated ( FIG. 5 , blocks 108 , 114 and 116 ). This command causes the text analysis to be performed to identify k-words and relations.
- a user may select what text to apply text analysis to. For example, a user may desire to “graph” an individual selection of text (e.g., one particular message input by a particular user), or may desire to graph several text messages in combination (e.g., the overall collection of all input messages). Accordingly, methods of the invention contemplate providing a graphical representation of k-words and relations from only one message or from a collection of related messages. The desired text may be selected by use of a keyboard, mouse, or other selector.
- the text analysis tool examines the collective text of all of the messages to identify k-words and relations in the collective text.
- all of the text messages are combined and treated as a single block of text. It has been discovered that it is often beneficial to perform steps of identifying and displaying k-words and relations of the overall discussion as opposed to discrete messages so an evolving graph display illustrates the history and Current status of the overall discussion.
- k-words and relations When identifying k-words and relations from more than one text message, application of the text analysis tools to the collection of the text messages preferably results in identifying relations that link a k-word from a first message to one from a second message. That is, k-words and relations are preferably identified that tie the multiple messages to one another.
- FIG. 7 illustrates an exemplary Keygraph display of a first message 122 of FIG. 6 . This might result, for instance, after one of the participants 14 ( FIG. 1 ) input the first message or highlighted the first message selected the Gr button 126 .
- the Keygraph of FIG. 8 represents k-words and relations from the first and second messages 122 of FIG. 6 combined. This might be generated, for instance, when one of the participants highlighted the first and second messages 122 and selected the Gr button 126 . Relations or links connecting k-words from the two different messages are shown, thereby representing the overall discussion and how the second message relates to the first.
- the Keygraph of FIG. 9 illustrates the result after several messages have been exchanged. K-words from different of the messages 122 are linked to one another by relations. Also, the k-words and links may differ somewhat from those of earlier Keygraphs as the participants focus on particular issues and/or areas and the discussion accordingly evolves.
- Exemplary screens displayed through methods of the invention may display a Keygraph on a first portion of the screen 150 , with the text messages 122 displayed on a second portion of the screen 152 .
- the first portion 150 may be a portion of the screen that pops-up when a graph command is issued.
- the relative sizing and position of the screen portion 150 may be varied as desired.
- Other exemplary screens include a dedicated first portion for displaying k-words and relations and a dedicated second portion for displaying the underlying communications data.
- the top half of a screen may display underlying communications data and the bottom half the graphical display or k-words and relations.
- FIG. 1 by way of illustration, as the participants 14 make contributions to the collaboration by communicating text messages to the computer 12 , this may have the effect of the participants 14 being able to see in substantially real time how the text they are entering changes the graphically displayed k-words and relations. As each participant 14 makes a contribution to the on-line discussion, for example, the overall frequency of occurrence of various terms may change, and therefore the k-words may change—some previous k-words may be replaced with new ones. This can be useful, for example, to keep the collaboration focused, and to identify promising directions and concepts for furthering the discussion.
- the exemplary invention embodiments described hereto generally include a collaboration occurring between the participants 14 . They may be sharing communications directed to solving a posed problem, for instance, over an on-line message board. Methods may include steps of the participants using resources in addition to themselves, including communicating with the exemplary outside sources of data such as the data repository 16 , the individuals 18 , or the real world 20 . In the exemplary invention embodiments described hereto, however, these outside data sources are generally communicated with to support the collaboration between the participants 14 . Steps of using the data sources 16 , 18 and 20 may be performed, for instance, to research ideas being exchanged between the participants 14 or to evaluate potential solutions.
- exemplary embodiments of the invention are directed to computer based collaborations wherein data from one or more outside data sources play a more central role in the collaboration.
- Data may be gathered and input to the network 10 that is the focus of the collaboration.
- the collaboration is directed to analyzing a dynamic event summarized by data being communicated to the network 10 .
- primary communications or “primary data” will be used to refer to the data input to the network 10 that is the focus of the collaboration, while the communications data shared between the participants 14 in analyzing or discussing the primary data will be referred to as “secondary data” or “secondary communications.”
- FIG. 11 is a flowchart illustrating one such exemplary method and program product of the invention.
- the method of FIG. 11 is similar to that of FIG. 5 in many aspects, with one difference being that the collaboration between the participants 14 ( FIG. 1 ) is focused on analyzing primary data being received by the network 10 . This may be illustrated through consideration of an example terrorism application.
- the method of FIG. 11 may find utility in an application wherein the participants 14 are intelligence analysts collaborating to identify credible terrorist targets in a rapidly unfolding terrorist attack scenario.
- Primary communications data may be received from the real world 20 (block 202 ).
- the real world data sources and primary data may be widely distributed, including international media reports, intelligence reports from intelligence agencies and police forces around the world, signal intelligence from the National Security Agency, CIA and FBI, and heterogeneous reports from defense and counter-intelligence reports.
- Embodiments of the present invention are useful to provide effective analysis of such varied and high volume data on a real time basis.
- Text analysis may be performed on this primary data being received from the outside world 20 to identify primary k-words and primary relations. (block 204 ).
- the text analysis tools may include Keygraphs and/or others.
- the text analysis may be applied to individual of the discrete primary data communications being received (e.g., to individual agent reports and news reports) or collectively to multiple of the discrete primary data communications (e.g., collect all CIA and FBI agent reports and perform text analysis).
- the text analysis tool may likewise be applied to identify numerical and non-alphabetic k-words that correspond to portions of interest of satellite imagery.
- a graphical display of the primary k-words and primary relations is then displayed to the analysts 14 to support their collaborative analysis of the data.
- the graphical display may comprise a chart, graph, outline or the like, with a Keygraph preferred.
- the analysts 14 review the displayed primary Keygraph and also may review the underlying primary data. They then share secondary communications data with one another over the network 10 to collaboratively develop a list of potential targets and threats using the graphically displayed primary k-words and primary relations generated from the step of applying text analysis to the primary communications data. (block 208 ).
- a step of using text analysis to identify secondary K-words and secondary relations from the secondary communications is performed (block 210 ), as well as a step of displaying the identified secondary k-words and secondary relations graphically using a chart, graph or the like. (block 212 ). Preferably this occurs through application of a Keygraph analysis and display of the resulting Keygraph. Through their collaborative sharing of secondary communications data, the analysts 14 may use the k-words and relations to formulate a solution set of potential terrorist targets and timelines of attack. (block 214 ).
- the graphical display of the primary k-words and relations may be made in a first portion of a screen and the secondary k-words and relations in a second portion of the screen.
- the first and second portions of the screen may be moved and resized as may be desirable.
- a third portion of the screen may be used to display any desired portion of the primary communications, and a fourth portion of the screen to display any desired portion of the secondary communications.
- the solution set is then presented to the individuals 18 over the network 10 for evaluation.
- the individuals 18 may comprise evaluative stakeholders such as front-line users of intelligence analysis such as military commanders, intelligence officers, embedded operatives, municipal fire officials, aviation administration officials and police officials. While they might not have the benefit of the “big-picture” perspective that the analysts 14 enjoy, the individuals 18 may be close to the action and have a better intuitive feel for evaluating which proposed targets and threats are credible.
- the individuals 18 evaluate the submitted list by rating, for instance, each proposed target/threat as credible or not. (block 218 ). They may also provide additional scoring, such as potential severity or timeliness of the threat.
- the individuals communicate their evaluation over the network 10 to the computer 12 and to the analysts 14 . Based on the received evaluation, the list of threats/targets may either be concluded to be final (blocks 220 , 222 ) or may be further evolved. Concluding the solution set is final may require, for example, that some high percentage of the individuals 18 (e.g., >75%) score all listed threats as “credible,” “potentially severe” and “timely.”
- a genetic operator (block 224 ), although other steps are contemplated.
- the analysts 14 may review the evaluation provided by the stakeholders 18 , may collaborate, and then improve or otherwise alter the solution set.
- the step of applying a genetic operator may be performed by a computer such as computer 12 or by one or more of the analysts 14 .
- Methods and program products of the invention such as that illustrated by FIG. 11 may be useful to quickly and effectively process widely distributed and voluminous primary data to identify credible and probable outcomes.
- chance discovery may identify k-words and relations from the incoming primary communications data that upon application of a Keygraph analysis identifies the possibility of a dirty bomb threat against U.S. troops on the continental U.S.
- the Keygraph output may be presented as a Pareto trade-off curve to the analysts 14 , who then share secondary communications to collaboratively discuss the threats. Keygraphs of their secondary communications show low-frequency secondary k-words that link critical high frequency secondary k-words. Secondary k-words include several potential dirty bomb targets. When further evolved through application of a genetic algorithm, a dirty bomb threat designed to jeopardize major troop and ship movements from Norfolk, Va. in the coming month of August is identified. This is passed on to the individuals 18 for evaluation, and they conclude the threat to be credible.
- Methods of the invention may also include further steps. For example, steps of using other tools to further narrow the solution set may be performed. Exemplary steps include application of modeling, simulation or predictive methods or software to predict the likely consequences of the dirty bomb threats.
- the analysts 14 may use data mining to analyze classified signal intelligence that has been stored in the data repository 16 to search the k-words “August,” “Norfolk” and “Virginia”. Suspicious signals are identified from the stored data, which are then confirmed and decrypted. The results of the data mining steps are displayed to the analysts 14 who then may share further secondary communications to discuss this information. As a result of these additional steps, the likelihood of the threat is further confirmed, potential perpetrators of the threat identified, and its potential date is further narrowed.
- Embodiments of the present invention will also be useful and beneficial in a wide variety of marketing applications.
- the participants 14 may be one or more of advertisers, marketing managers, product developers and manufacturing engineers. These participants may be collaborating to identify new marketing and product opportunities.
- the individuals 18 may be a consumer focus group communicated with over the network 10 to survey their likes and dislikes. Opinion data or responses to survey questions, referred to as primary data, may be communicated by the individuals 18 over the network 10 to the participants 14 .
- a step of applying text analysis to the primary data may be performed, with identified primary k-words and primary relations then displayed to the participants 14 . They may then share secondary communications data to collaboratively identify marketing opportunities and new product ideas.
- Proposed products developed through the collaboration can be presented to the individuals 18 over the network 10 , with their response to these proposed new products being primary data communicated back to the participants 14 .
- the participants may view in substantially real-time primary k-words and primary relations in a graphical format identified in the primary data. Iterations of this may be performed to evolve a suitable new product.
- FIG. 12 Attention is now directed to the flowchart of FIG. 12 .
- Invention embodiments as illustrated by the flowchart of FIG. 12 are generally consistent with those of FIG. 2 , with two differences being that the sequence of steps has been altered and additional steps have been included.
- the individuals 18 are consulted initially to provide an initial solution set that is then further evolved through collaborative discussion by the participants 14 .
- An initial solution set comprising aspects of the automaker's existing styling and features as well as its competitor's is developed (block 252 ) and communicated over the network 10 to the consumers 18 for evaluation. (block 254 ).
- the solution set may comprise text (e.g., “minivan with two sliding doors and a sunroof”), images (e.g., a photograph of a minivan with a drastically sloping hood and protruding headlights), or the like.
- the consumers 18 react to the solutions in the solution set by scoring them on a scale of 1-10, and this evaluation data is communicated over the network for reception by the computer 12 and the participants 14 (block 256 ).
- a step of applying a genetic algorithm is performed to evolve a new set of features. (block 258 ).
- the scoring provided by the individuals 18 may be used in applying the genetic operator. This step may include, for instance, substitution of the headlights and hood from one high scoring car model put onto a low scoring model, or the mutation of a low scoring car's shape into a more desirably scored higher and boxier shape.
- the new solution set showing new features generated through application of one or more genetic operators is presented to the focus groups for evaluation (block 258 ).
- the results of the evaluation are communicated over the network as they evolve in substantially real time to the participants 14 , who may be the automaker's senior managers, marketers, and manufacturing engineers, for instance.
- the initial solution generations may track current market share data, but as iterations continue new solution sets may show the automaker's current product line falling farther and farther outside of what is desired by the individuals 18 .
- the iterative evolution of newer solution sets may also identify opportunities for desirable products and features. For example, the consumers 18 may show a preference for SUV-like vehicles that have the speed and handling of a sports car and higher gas mileage than current SUV's. Minivans recast as large SUV-like vehicles are also surprisingly popular.
- a step of using a text analysis tool may be performed to identify k-words and relations in the shared communications, with the k-words and relations then displayed graphically. (blocks 262 , 264 ).
- the participants 14 use the graphical output to identify opportunities for global integration of three of seven auto platforms, and identify likely locations for cost-effective production.
- Additional steps may also be performed to further evolve the solutions.
- a step of using a genetic algorithm may be performed, where the participants 14 or the computer 12 may apply a genetic operator(s) to the initially identified platforms and likely manufacturing facilities to further narrow the potential solutions.
- An additional exemplary step may also be performed of using data mining to analyze consumer preference data stored in the data storage 16 to build a new consumer preference predictive model that can then be used to design an advertising campaign for the new line of vehicles.
- the developed advertising campaign may be presented to a new set of consumers 18 who suggest modest modifications in three areas to bolster appeal across the consumer spectrum.
- Some exemplary invention embodiments that include primary and secondary data may follow the general sequence of 1) gathering primary data and communicating it to the network 10 , 2) collaborative sharing of secondary data between participants 14 to discuss the primary data, 3) the participants 14 defining a particular problem, 4) the participants 14 proposing a solution set to the problem, and 5) the solution set being evaluated by the individuals 18 .
- it can be useful for the sequencing of steps to be controlled by a moderator. For example, it may be useful for one of the participants 14 to be designated a moderator and given the authority to determine when a step is completed and the next step begun. Without a moderator with this authority, it has been discovered that collaborations can become bogged down and cumbersome.
- methods, systems, and program products of the invention may include a step of designating one of the participants 14 as a moderator with the authority to determine completion of various steps of the invention.
Abstract
Description
-
- 1. Document compaction: Words likely to be insignificant are removed from the document using a list of words and word stems. The list may be supplied from a source or be user specified, may be designated to include prepositions and pronouns, and the like. For example, words such as “the,” “he,” “it,” “at,” etc. may be removed or replaced. Also, the list may include word stems that are used to reduce related words to the same root. For example, words like “innovate”, “innovates”, and “innovating” are reduced to “innovate.”
- 2. Conversion to phrases: The text is converted to a series of phrases which may or may not be k-words. Preference is given to longer phrases with higher frequency. A subset of phrase words are chosen from the document and all possible phrases out of those words are constructed. A phrase that occurs with the highest frequency in the document is retained.
After preprocessing, the document D is reduced to D′ which consists of unique terms w1; w2; . . . , where a term wi refers to either a word or a phrase.
where wi and wj are elements of the set NHF, and |wi|s is the number of times a term wi occurs in a sentence s. The assoc values are computed for all pairs of high-frequency terms in NHF. The term-pairs are sorted according to their assoc values and the top NHF−1 tightly associated term-pairs are taken to be the links. The relations between term-pairs are represented by the edges in G.
where g is a cluster, and
where |g|s is the number of times a cluster g occurs in a sentence s.
Claims (28)
Priority Applications (1)
| Application Number | Priority Date | Filing Date | Title |
|---|---|---|---|
| US11/119,636 US7904512B2 (en) | 2004-06-10 | 2005-05-02 | Methods and systems for computer based collaboration |
Applications Claiming Priority (2)
| Application Number | Priority Date | Filing Date | Title |
|---|---|---|---|
| US57868804P | 2004-06-10 | 2004-06-10 | |
| US11/119,636 US7904512B2 (en) | 2004-06-10 | 2005-05-02 | Methods and systems for computer based collaboration |
Publications (2)
| Publication Number | Publication Date |
|---|---|
| US20050276479A1 US20050276479A1 (en) | 2005-12-15 |
| US7904512B2 true US7904512B2 (en) | 2011-03-08 |
Family
ID=35460581
Family Applications (1)
| Application Number | Title | Priority Date | Filing Date |
|---|---|---|---|
| US11/119,636 Expired - Fee Related US7904512B2 (en) | 2004-06-10 | 2005-05-02 | Methods and systems for computer based collaboration |
Country Status (1)
| Country | Link |
|---|---|
| US (1) | US7904512B2 (en) |
Cited By (2)
| Publication number | Priority date | Publication date | Assignee | Title |
|---|---|---|---|---|
| US9317810B2 (en) | 2012-07-26 | 2016-04-19 | The Boeing Company | Intelligence analysis |
| US20200193380A1 (en) * | 2018-12-14 | 2020-06-18 | International Business Machines Corporation | Detection and categorization of electronic communications |
Families Citing this family (21)
| Publication number | Priority date | Publication date | Assignee | Title |
|---|---|---|---|---|
| US20060212279A1 (en) * | 2005-01-31 | 2006-09-21 | The Board of Trustees of the University of Illinois and | Methods for efficient solution set optimization |
| US8819536B1 (en) | 2005-12-01 | 2014-08-26 | Google Inc. | System and method for forming multi-user collaborations |
| US8131656B2 (en) * | 2006-01-31 | 2012-03-06 | The Board Of Trustees Of The University Of Illinois | Adaptive optimization methods |
| US7979365B2 (en) * | 2006-01-31 | 2011-07-12 | The Board Of Trustees Of The University Of Illinois | Methods and systems for interactive computing |
| US20060173732A1 (en) * | 2006-02-21 | 2006-08-03 | Gerald Edwards | Method of collaboratively solving a problem |
| US8725729B2 (en) | 2006-04-03 | 2014-05-13 | Steven G. Lisa | System, methods and applications for embedded internet searching and result display |
| US8046372B1 (en) * | 2007-05-25 | 2011-10-25 | Amazon Technologies, Inc. | Duplicate entry detection system and method |
| TW200928810A (en) * | 2007-12-31 | 2009-07-01 | Aletheia University | Method for searching data |
| EP2273440A1 (en) * | 2009-07-08 | 2011-01-12 | Alcatel Lucent | Method and device for obtaining technical information according to information on satisfaction when using a service and/or product provided by communication terminal users |
| US8977979B2 (en) * | 2010-12-06 | 2015-03-10 | International Business Machines Corporation | Social network relationship mapping |
| WO2013043159A1 (en) * | 2011-09-20 | 2013-03-28 | Hewlett-Packard Development Company, L.P. | Document analysis |
| US9256650B2 (en) | 2013-01-23 | 2016-02-09 | International Business Machines Corporation | Using metaphors to present concepts across different intellectual domains |
| US9264505B2 (en) * | 2013-01-31 | 2016-02-16 | Hewlett Packard Enterprise Development Lp | Building a semantics graph for an enterprise communication network |
| JP5963312B2 (en) * | 2013-03-01 | 2016-08-03 | インターナショナル・ビジネス・マシーンズ・コーポレーションInternational Business Machines Corporation | Information processing apparatus, information processing method, and program |
| US10528610B2 (en) * | 2014-10-31 | 2020-01-07 | International Business Machines Corporation | Customized content for social browsing flow |
| US10402408B2 (en) | 2016-11-04 | 2019-09-03 | Microsoft Technology Licensing, Llc | Versioning of inferred data in an enriched isolated collection of resources and relationships |
| US10481960B2 (en) | 2016-11-04 | 2019-11-19 | Microsoft Technology Licensing, Llc | Ingress and egress of data using callback notifications |
| US11475320B2 (en) | 2016-11-04 | 2022-10-18 | Microsoft Technology Licensing, Llc | Contextual analysis of isolated collections based on differential ontologies |
| US10452672B2 (en) | 2016-11-04 | 2019-10-22 | Microsoft Technology Licensing, Llc | Enriching data in an isolated collection of resources and relationships |
| US10614057B2 (en) * | 2016-11-04 | 2020-04-07 | Microsoft Technology Licensing, Llc | Shared processing of rulesets for isolated collections of resources and relationships |
| US10885114B2 (en) | 2016-11-04 | 2021-01-05 | Microsoft Technology Licensing, Llc | Dynamic entity model generation from graph data |
Citations (10)
| Publication number | Priority date | Publication date | Assignee | Title |
|---|---|---|---|---|
| US5930762A (en) | 1996-09-24 | 1999-07-27 | Rco Software Limited | Computer aided risk management in multiple-parameter physical systems |
| US5940816A (en) | 1997-01-29 | 1999-08-17 | International Business Machines Corporation | Multi-objective decision-support methodology |
| US5963902A (en) | 1997-07-30 | 1999-10-05 | Nynex Science & Technology, Inc. | Methods and apparatus for decreasing the size of generated models trained for automatic pattern recognition |
| US6490572B2 (en) | 1998-05-15 | 2002-12-03 | International Business Machines Corporation | Optimization prediction for industrial processes |
| US20030115192A1 (en) * | 2001-03-07 | 2003-06-19 | David Kil | One-step data mining with natural language specification and results |
| US6615205B1 (en) | 2000-12-22 | 2003-09-02 | Paul M. Cereghini | Horizontal implementation of expectation-maximization algorithm in SQL for performing clustering in very large databases |
| US20030182439A1 (en) * | 1992-09-25 | 2003-09-25 | Geshwind David Michael | Class of methods for improving perceived efficiency of end-user interactive access of a large database such as the World-Wide Web via a communication network such as "The Internet" |
| US6768973B1 (en) | 2000-04-12 | 2004-07-27 | Unilever Home & Personal Care Usa, Division Of Conopco, Inc. | Method for finding solutions |
| US20050005232A1 (en) * | 2003-07-02 | 2005-01-06 | International Business Machines Corporation | Web services access to classification engines |
| US7146381B1 (en) * | 1997-02-10 | 2006-12-05 | Actioneer, Inc. | Information organization and collaboration tool for processing notes and action requests in computer systems |
-
2005
- 2005-05-02 US US11/119,636 patent/US7904512B2/en not_active Expired - Fee Related
Patent Citations (10)
| Publication number | Priority date | Publication date | Assignee | Title |
|---|---|---|---|---|
| US20030182439A1 (en) * | 1992-09-25 | 2003-09-25 | Geshwind David Michael | Class of methods for improving perceived efficiency of end-user interactive access of a large database such as the World-Wide Web via a communication network such as "The Internet" |
| US5930762A (en) | 1996-09-24 | 1999-07-27 | Rco Software Limited | Computer aided risk management in multiple-parameter physical systems |
| US5940816A (en) | 1997-01-29 | 1999-08-17 | International Business Machines Corporation | Multi-objective decision-support methodology |
| US7146381B1 (en) * | 1997-02-10 | 2006-12-05 | Actioneer, Inc. | Information organization and collaboration tool for processing notes and action requests in computer systems |
| US5963902A (en) | 1997-07-30 | 1999-10-05 | Nynex Science & Technology, Inc. | Methods and apparatus for decreasing the size of generated models trained for automatic pattern recognition |
| US6490572B2 (en) | 1998-05-15 | 2002-12-03 | International Business Machines Corporation | Optimization prediction for industrial processes |
| US6768973B1 (en) | 2000-04-12 | 2004-07-27 | Unilever Home & Personal Care Usa, Division Of Conopco, Inc. | Method for finding solutions |
| US6615205B1 (en) | 2000-12-22 | 2003-09-02 | Paul M. Cereghini | Horizontal implementation of expectation-maximization algorithm in SQL for performing clustering in very large databases |
| US20030115192A1 (en) * | 2001-03-07 | 2003-06-19 | David Kil | One-step data mining with natural language specification and results |
| US20050005232A1 (en) * | 2003-07-02 | 2005-01-06 | International Business Machines Corporation | Web services access to classification engines |
Non-Patent Citations (27)
| Title |
|---|
| Altus, S., Kroo. I., & Gage, P., A Genetic Algorithm for Scheduling and Decomposition of Multidisciplinary Design Problems, ASME Journal of Mechanical Design, vol. 118, Dec. 1996. |
| Bingham, E., Kaban, A., & Girolami, M., (2003). "Topic identification in dynamical text by complexity pursuit." Neural Processing Letters, 17(1), 69-83. |
| Goldberg, D. E., "Genetic Algorithms in Search, Optimization & Machine Learning," Addison Wesley Longman, Inc., 1989. |
| Goldberg, D. E., "The Design of Innovation: Lessons from and for Competent Genetic Algorithms," Kluwer Academic Publishers, 2002. |
| Goldberg, D. E., (1993a). "Making genetic algorithms fly: A lesson from the Wright brothers." Advanced Technology for Developers, 2, 1-8. |
| Goldberg, D. E., (1993b). "A Wright-brothers theory of genetic algorithms flight." Systems, Control, and Information, 37(8), 450-458. |
| Goldberg, D.E., Deb, K., Kargupta, H., Harik, G.: Rapid, accurate optimization of difficult problems using fast messy genetic algorithms. Proceedings of the Fifth International Conference on Genetic Algorithms pp. 56-64 (1993). |
| Goldberg, D.E., Sastry K., and Ohsawa Y., "Discovering Deep Building Blocks for Competent Genetic Algorithms Using Chance Discovery via KeyGraphs," (2003) pp. 1-23. |
| Goldberg. D.E., Sastry K., and Ohsawa Y., "Discovering Deep Building Blocks for Competent Genetic Algorithms Using Chace Discovery via KeyGraph.." (2003) pp. 1-23. * |
| Graetz, K., Barlow, C., Proulx, N., & Pape, L. (1997). "Facilitating idea generation in computer-based teleconferences," Proceedings of the International ACM SIGGROUP Conference on Supporting Group Work (GROUP '97), 317-324. |
| Harik, G., Linkage learning via probabilistic modeling in the ECGA. IlliGAL TR-99010, University of Illinois at Urbana-Champaign. Urbana, IL, 1999. |
| Kosorukoff, A., & Goldberg, D. E. (2002). "Evolutionary computation as a form of organization." Proceedings of the Genetic and Evolutionary Computation Conference (GECCO 2002), 965-972. |
| Lutz, R., Recovering High-Level Structure of Software Systems Using a Minimum Description Length Principle, R.F.E. Proceedings of the 13th Irish International Conference, Artificial Intelligence and Cognitive Science (AICS 2002), Sep. 2002. |
| Munemoto, M., & Goldberg, D.E., Liknage Identification by Non-monotonocity Detection for Overlapping Functions. IlliGAL Report No. 99005, Genetic and Evolutionary Computation Conference (GECCO-99), vol. 1, 1999. |
| Ohsawa, Y. (2002). Chance discoveries for making decisions in complex real world. New Generation Computing, 20(2), 143-163. |
| Ohsawa, Y., & Nara, Y. (2002). Understanding Internet users on double helical model of chance-discovery process. In Proceedings of the 2002 IEEE International Symposium on Intelligent Control. pp. 844-849. |
| Ohsawa, Y., Benson, N. E., & Yachida, M., (1998) "KeyGraph: Automatic indexing by co-occurrence graph based on building construction metaphor." In Proceedings of Advances in Digital Libraries, pp. 12-18. |
| Oshawa, Y. "KeyGraph: Automatic indexing by co-occurrence graph basd on building construction metaphor." (1998) pp. 12-18. * |
| Pelikan, M., Goldberg, D.E., & Cantú-Paz, E., BOA: The Bayesian optimization algorithm. Proceedings of the Genetic and Evolutionary Computation Conference (GECCO-99), vol. 1, pp. 525-532. Also IlliGAL TR-99003, University of Illinois at Urbana-Champaign, 1999. |
| Rogers. J. L., DeMAID/GA User's Guide-Design Manager's Aid for Intelligent Decomposition With a Genetic Algorithm, NASA TM-110241, Apr. 1996. |
| Salman. A., Mehrota, K., & Mohan, C., Linkage Crossover for Genetic Algorithms, Proceedings of the Genetic and Evolutionary Computation Conference (GECCO-99), vol. 1, pp. 564-571, 1999. |
| Santanem, E., Briggs, R., & de Vreede, G. J., (2000). "The Cognitive Network Model of Creativity: a New Casual Model for Creativity and a New Brainstorming Technique," Proceedings of the 33rd Annual Hawaii International Conference on System Sciences, 2004. |
| Santanem, E., Briggs, R., & de Vreede, G.-J., (2002). "Toward an Understanding of Creative Solution Generation," Proceedings of the 35th Annual Hawaii International Conference on System Sciences, 2899-2908. |
| Smith, J. On Appropriate Adaptation Levels for the Learning of Gene Linkage. Journal of Genetic Programming and Evolvable Machines, vol. 3, No. 2, pp. 129-155, 2002. |
| Takagi, H. (2001). "Interactive evolutionary computation: Fusion of the capabilities of EC optimization and human evaluation." Proceedings of the IEEE, 89(9), 1275-1296. |
| Takama, Y., & Hirota, K. (2000). "Discovery of topic distribution through WWW information retrieval process." Proceedings of 2000 IEEE International Conference on Industrial Electronics, Control and Instrumentation, 1644-1647. |
| Welge, M. E., Auvil, L., Shirk, A., Bushell, C., Bajcsy, P., Cai, D., Redman, T., Clutter, D., Aydt, R., & Tcheng, D., (2003). Data to Knowledge (D2K) (Automated Learning Group Technical Report). Urbana, IL: National Center for Supercomputing Applications, University of Illinois at Urbana-Champaign. |
Cited By (4)
| Publication number | Priority date | Publication date | Assignee | Title |
|---|---|---|---|---|
| US9317810B2 (en) | 2012-07-26 | 2016-04-19 | The Boeing Company | Intelligence analysis |
| US20200193380A1 (en) * | 2018-12-14 | 2020-06-18 | International Business Machines Corporation | Detection and categorization of electronic communications |
| US10984388B2 (en) * | 2018-12-14 | 2021-04-20 | International Business Machines Corporation | Identifying complaints from messages |
| US11276040B2 (en) | 2018-12-14 | 2022-03-15 | International Business Machines Corporation | Identifying complaints from messages |
Also Published As
| Publication number | Publication date |
|---|---|
| US20050276479A1 (en) | 2005-12-15 |
Similar Documents
| Publication | Publication Date | Title |
|---|---|---|
| US7904512B2 (en) | Methods and systems for computer based collaboration | |
| US11003864B2 (en) | Artificial intelligence optimized unstructured data analytics systems and methods | |
| Gloor et al. | Web science 2.0: Identifying trends through semantic social network analysis | |
| Magruk | Innovative classification of technology foresight methods | |
| US10096034B2 (en) | Technology event detection, analysis, and reporting system | |
| Sobkowicz et al. | Opinion mining in social media: Modeling, simulating, and forecasting political opinions in the web | |
| Kalampokis et al. | Linked open government data analytics | |
| US20160335345A1 (en) | Unstructured data analytics systems and methods | |
| CN105740228A (en) | Internet public opinion analysis method | |
| US11205130B2 (en) | Mental modeling method and system | |
| Wang et al. | Modeling customer preferences using multidimensional network analysis in engineering design | |
| Devaney et al. | Environmental literacy and deliberative democracy: a content analysis of written submissions to the Irish Citizens’ Assembly on climate change | |
| WO2006096526A2 (en) | Systems and methods for visualizing arguments | |
| Escobar et al. | Network coincidence analysis: the netCoin R package | |
| Cunningham et al. | Characterizing ego-networks using motifs | |
| Yates et al. | The Oxford handbook of digital technology and society | |
| Kleanthous et al. | Perception of fairness in algorithmic decisions: future developers' perspective | |
| Akila et al. | Opinion mining on food services using topic modeling and machine learning algorithms | |
| Lee et al. | Developing technology assessment methodology: Some insights and experiences | |
| Santagiustina et al. | The architecture of partisan debates: The online controversy on the no-deal Brexit | |
| Kumar et al. | Exfoliating decision support system: a synthesis of themes using text mining | |
| Trujillo-Cabezas et al. | Integrating soft computing into strategic prospective methods: towards an adaptive learning environment supported by futures studies | |
| Pinto | Data representation factors and dimensions from the quality function deployment (QFD) perspective | |
| Jasim et al. | Analyzing Social Media Sentiment: Twitter as a Case Study | |
| Lopes et al. | Unraveling the semantic evolution of core nodes in a global contribution network |
Legal Events
| Date | Code | Title | Description |
|---|---|---|---|
| AS | Assignment |
Owner name: BOARD OF TRUSTEES OF THE UNIVERSITY OF ILLINOIS, T Free format text: ASSIGNMENT OF ASSIGNORS INTEREST;ASSIGNORS:GOLDBERG, DAVID E.;WELGE, MICHAEL E.;LLORA, XAVIER F.;SIGNING DATES FROM 20050530 TO 20050627;REEL/FRAME:016750/0503 Owner name: BOARD OF TRUSTEES OF THE UNIVERSITY OF ILLINOIS, T Free format text: ASSIGNMENT OF ASSIGNORS INTEREST;ASSIGNORS:GOLDBERG, DAVID E.;WELGE, MICHAEL E.;LLORA, XAVIER F.;REEL/FRAME:016750/0503;SIGNING DATES FROM 20050530 TO 20050627 |
|
| AS | Assignment |
Owner name: NAVY, SECRETARY OF THE UNITED STATES OF AMERICA, V Free format text: CONFIRMATORY LICENSE;ASSIGNOR:ILLINOIS, UNIVERSITY OF, THE;REEL/FRAME:017381/0971 Effective date: 20050624 |
|
| STCF | Information on status: patent grant |
Free format text: PATENTED CASE |
|
| CC | Certificate of correction | ||
| FPAY | Fee payment |
Year of fee payment: 4 |
|
| MAFP | Maintenance fee payment |
Free format text: PAYMENT OF MAINTENANCE FEE, 8TH YR, SMALL ENTITY (ORIGINAL EVENT CODE: M2552); ENTITY STATUS OF PATENT OWNER: SMALL ENTITY Year of fee payment: 8 |
|
| FEPP | Fee payment procedure |
Free format text: MAINTENANCE FEE REMINDER MAILED (ORIGINAL EVENT CODE: REM.); ENTITY STATUS OF PATENT OWNER: SMALL ENTITY |
|
| LAPS | Lapse for failure to pay maintenance fees |
Free format text: PATENT EXPIRED FOR FAILURE TO PAY MAINTENANCE FEES (ORIGINAL EVENT CODE: EXP.); ENTITY STATUS OF PATENT OWNER: SMALL ENTITY |
|
| STCH | Information on status: patent discontinuation |
Free format text: PATENT EXPIRED DUE TO NONPAYMENT OF MAINTENANCE FEES UNDER 37 CFR 1.362 |
|
| FP | Lapsed due to failure to pay maintenance fee |
Effective date: 20230308 |