US7673191B2 - Baselining backend component error rate to determine application performance - Google Patents
Baselining backend component error rate to determine application performance Download PDFInfo
- Publication number
- US7673191B2 US7673191B2 US11/559,755 US55975506A US7673191B2 US 7673191 B2 US7673191 B2 US 7673191B2 US 55975506 A US55975506 A US 55975506A US 7673191 B2 US7673191 B2 US 7673191B2
- Authority
- US
- United States
- Prior art keywords
- application
- backend
- error rate
- data
- respect
- Prior art date
- Legal status (The legal status is an assumption and is not a legal conclusion. Google has not performed a legal analysis and makes no representation as to the accuracy of the status listed.)
- Active, expires
Links
Images


Classifications
-
- G—PHYSICS
- G06—COMPUTING; CALCULATING OR COUNTING
- G06F—ELECTRIC DIGITAL DATA PROCESSING
- G06F11/00—Error detection; Error correction; Monitoring
- G06F11/07—Responding to the occurrence of a fault, e.g. fault tolerance
- G06F11/0703—Error or fault processing not based on redundancy, i.e. by taking additional measures to deal with the error or fault not making use of redundancy in operation, in hardware, or in data representation
- G06F11/0751—Error or fault detection not based on redundancy
- G06F11/0754—Error or fault detection not based on redundancy by exceeding limits
- G06F11/076—Error or fault detection not based on redundancy by exceeding limits by exceeding a count or rate limit, e.g. word- or bit count limit
-
- G—PHYSICS
- G06—COMPUTING; CALCULATING OR COUNTING
- G06F—ELECTRIC DIGITAL DATA PROCESSING
- G06F11/00—Error detection; Error correction; Monitoring
- G06F11/07—Responding to the occurrence of a fault, e.g. fault tolerance
- G06F11/0703—Error or fault processing not based on redundancy, i.e. by taking additional measures to deal with the error or fault not making use of redundancy in operation, in hardware, or in data representation
- G06F11/0706—Error or fault processing not based on redundancy, i.e. by taking additional measures to deal with the error or fault not making use of redundancy in operation, in hardware, or in data representation the processing taking place on a specific hardware platform or in a specific software environment
- G06F11/0709—Error or fault processing not based on redundancy, i.e. by taking additional measures to deal with the error or fault not making use of redundancy in operation, in hardware, or in data representation the processing taking place on a specific hardware platform or in a specific software environment in a distributed system consisting of a plurality of standalone computer nodes, e.g. clusters, client-server systems
-
- G—PHYSICS
- G06—COMPUTING; CALCULATING OR COUNTING
- G06F—ELECTRIC DIGITAL DATA PROCESSING
- G06F11/00—Error detection; Error correction; Monitoring
- G06F11/07—Responding to the occurrence of a fault, e.g. fault tolerance
- G06F11/0703—Error or fault processing not based on redundancy, i.e. by taking additional measures to deal with the error or fault not making use of redundancy in operation, in hardware, or in data representation
- G06F11/0706—Error or fault processing not based on redundancy, i.e. by taking additional measures to deal with the error or fault not making use of redundancy in operation, in hardware, or in data representation the processing taking place on a specific hardware platform or in a specific software environment
- G06F11/0748—Error or fault processing not based on redundancy, i.e. by taking additional measures to deal with the error or fault not making use of redundancy in operation, in hardware, or in data representation the processing taking place on a specific hardware platform or in a specific software environment in a remote unit communicating with a single-box computer node experiencing an error/fault
-
- G—PHYSICS
- G06—COMPUTING; CALCULATING OR COUNTING
- G06F—ELECTRIC DIGITAL DATA PROCESSING
- G06F11/00—Error detection; Error correction; Monitoring
- G06F11/22—Detection or location of defective computer hardware by testing during standby operation or during idle time, e.g. start-up testing
- G06F11/2294—Detection or location of defective computer hardware by testing during standby operation or during idle time, e.g. start-up testing by remote test
-
- G—PHYSICS
- G06—COMPUTING; CALCULATING OR COUNTING
- G06F—ELECTRIC DIGITAL DATA PROCESSING
- G06F11/00—Error detection; Error correction; Monitoring
- G06F11/30—Monitoring
- G06F11/34—Recording or statistical evaluation of computer activity, e.g. of down time, of input/output operation ; Recording or statistical evaluation of user activity, e.g. usability assessment
- G06F11/3409—Recording or statistical evaluation of computer activity, e.g. of down time, of input/output operation ; Recording or statistical evaluation of user activity, e.g. usability assessment for performance assessment
- G06F11/3419—Recording or statistical evaluation of computer activity, e.g. of down time, of input/output operation ; Recording or statistical evaluation of user activity, e.g. usability assessment for performance assessment by assessing time
-
- G—PHYSICS
- G06—COMPUTING; CALCULATING OR COUNTING
- G06F—ELECTRIC DIGITAL DATA PROCESSING
- G06F11/00—Error detection; Error correction; Monitoring
- G06F11/30—Monitoring
- G06F11/34—Recording or statistical evaluation of computer activity, e.g. of down time, of input/output operation ; Recording or statistical evaluation of user activity, e.g. usability assessment
- G06F11/3447—Performance evaluation by modeling
-
- G—PHYSICS
- G06—COMPUTING; CALCULATING OR COUNTING
- G06F—ELECTRIC DIGITAL DATA PROCESSING
- G06F11/00—Error detection; Error correction; Monitoring
- G06F11/30—Monitoring
- G06F11/34—Recording or statistical evaluation of computer activity, e.g. of down time, of input/output operation ; Recording or statistical evaluation of user activity, e.g. usability assessment
- G06F11/3466—Performance evaluation by tracing or monitoring
- G06F11/3495—Performance evaluation by tracing or monitoring for systems
-
- G—PHYSICS
- G06—COMPUTING; CALCULATING OR COUNTING
- G06F—ELECTRIC DIGITAL DATA PROCESSING
- G06F2201/00—Indexing scheme relating to error detection, to error correction, and to monitoring
- G06F2201/87—Monitoring of transactions
Definitions
- One approach for managing an application involves monitoring the application, generating data regarding application performance and analyzing the data to determine application health.
- Some system management products analyze a large number of data streams to try to determine a normal and abnormal application state. Large numbers of data streams are often analyzed because the system management products don't have a semantic understanding of the data being analyzed. Accordingly, when an unhealthy application state occurs, many data streams will have abnormal data values because the data streams are causally related to one another. Because the system management products lack a semantic understanding of the data, they cannot assist the user in determining either the ultimate source or cause of a problem. Additionally, these application management systems may not know whether a change in data indicates an application is actually unhealthy or not.
- the technology described herein determines the health of one or more backend machines invoked to process a request for an application.
- Performance data generated in response to monitoring application execution is processed to select data related to backend error rate.
- the selected backend error data is processed to predict future values of a time series of data.
- the time series of data may relate to backend performance metrics such as error rate or some other metric.
- the predicted values are compared to actual values in the time series of data to determine a deviation from the predicted value. Deviation information for the time series data is then reported to a user through an interface.
- the deviation information may be associated with a deviation range.
- a number of deviation ranges can be configured to extend from a predicted value of a data point.
- the actual data point value is contained in one of the ranges depending on how far the actual data point deviates from the predicted value.
- the deviation information for the actual data point with respect to the predicted data point may be communicated through an interface as an indication of deviation level (e.g., low, medium, high) and updated as additional data points in the time series are processed.
- a deviation range may be selected for a data point based on two or more predicted values for the data point.
- two or more functions may be fit to past time series values of data and used to predict the next data point value in the data series.
- the predicted values and corresponding deviation range information are processed to select an overall deviation range based on factors such as highest number of occurrences, degree of deviation, and/or other factors.
- the deviation information may be provided through an interface as health information for a backend.
- the interface may provide health and/or performance information associated with a number of backends that are invoked by an application.
- the backend health information may be grouped by application, URL or in some other manner.
- the backend health information may be presented as one of several levels of health by a graphical icon, such as a green icon for a normal deviation level, a yellow icon for a caution deviation level and a red icon for a warning deviation level.
- a backend may be implemented as a database, another application server or other server, or some other remote machine in communication with an application on an application server.
- a backend may be implemented as a remote system that receives requests or other communications from an application, processes the communication and provides a response to the communication.
- the backend could be another network service.
- Some embodiments may access performance data which is generated from monitoring two or more applications, associated with one or more remote systems which process requests from the two or more applications, and includes remote system error rates for the one or more remote systems with respect to the two or more applications for a first period of time.
- a difference is determined between one of the remote system error rates and a predicted error rate for the one or more remote systems with respect to a first application of the two or more applications.
- Health information is then provided for the one or more remote systems with respect to the first application.
- the health information may be derived from the difference between the one of the remote system error rates and the predicted error rate for the one or more remote systems and can represent the health of the one or more remote systems for the first period of time.
- Some embodiments may access performance data which is generated from monitoring two or more applications for a first period of time, associated with one or more backends which process requests from the two or more applications, and includes an error rate for each backend with respect to each application of the two or more applications.
- a value is predicted for the backend error rate for a first backend of the one or more backends with respect to a first application of the two or more applications.
- the predicted backend error rate value is compared to the backend error rate value for the first backend with respect to a first application of the two or more applications.
- a deviation range is identified from two or more deviation ranges for the difference between the predicted backend error rate value and the actual backend error rate value for the first backend with respect to a first application of the two or more applications.
- a user interface is then displayed for providing backend health information for one or more backends with respect to the first application.
- the backend health information is provided for the first backend with respect to the first application in the user interface, the backend health information based on
- FIG. 1A is a block diagram of an embodiment of a system for determining transaction performance.
- FIG. 1B is an example of an interface for providing transaction performance information.
- FIG. 1C is an example of a graph illustrating a metric value over time.
- FIG. 2A depicts an exemplar process for modifying an application's bytecode.
- FIG. 2B is a block diagram of a system for monitoring an application.
- FIG. 2C illustrates an embodiment of a computing system for use with the present technology.
- FIG. 3 is a flow chart of an embodiment of a process for providing application performance information to the user.
- FIG. 4 is a flow chart of an embodiment of a process for providing baseline deviation information to a user.
- FIG. 5 is a flow chart of an embodiment of a process for predicting a data point.
- FIG. 6A is a flow chart of an embodiment of a process for determining deviation level for data point.
- FIG. 6B is a flow chart of an embodiment of a process for determining deviation count for data point.
- FIG. 6C is a flow chart of an embodiment of a process for determining deviation notification for data point.
- FIG. 7 is a flow chart of an embodiment of a process for providing baseline deviation information to a user.
- An application monitoring system determines the health of one or more backend machines invoked to process a request for an application. Performance data is generated in response to monitoring application execution. A portion of the performance data related to backends is retrieved and processed to predict data values from previous data values.
- the backend performance data may be a time series of data. The time series of data may relate to a metric associated with the performance of the backend, such as backend response time, error rate, stall rate or some other metric. The predicted values are compared to actual values in the time series of data to determine a deviation for the actual value. Deviation information for the time series data is reported to a user through an interface. The user may then determine if a backend is unhealthy or not based on the deviation information for the backend and whether application performance is being affected by a corresponding backend.
- the deviation information reported to a user is based on a deviation range for the actual data point value.
- a number of deviation ranges can be generated based on the predicted value.
- the actual data point will be contained in one of the ranges, wherein the deviation associated with the range is proportional to how far the range is from the predicted value. For example, a range that contains the predicted value may be associated with a low deviation, a range adjacent to the low deviation range may have a medium deviation, and another range adjacent to the medium deviation range may have a high deviation.
- An indication of which range contains the actual data point value may be presented to a user through an interface and updated as different data points in the time series are processed.
- a deviation range may be selected for a time series data point based on two or more predicted values for the data point.
- two or more functions may be fit to past time series values and used to calculate future data point values in the series data.
- Deviation ranges are configured for each predicted value, and each predicted value is contained in one of its corresponding ranges. The different predicted values and corresponding deviation ranges are processed to select an overall deviation range based on highest number of occurrences, degree of deviation, and/or other factors.
- the deviation information may be provided through an interface as health information for a backend.
- the interface may provide health and/or performance information associated with a number of backends that are invoked by an application to process a request.
- the backend health information may be grouped by application, URL or in some other manner.
- the backend health information may be presented as one of several levels of health. For example, graphical health icons may be used to indicate whether the backend health is at a level of low, medium or high concern. In some embodiments, a low level may be communicated as a green icon, a medium level may be indicated as a yellow icon and a high level of concern may be communicated as a red icon.
- FIG. 1A is a block diagram of an embodiment of a system for determining transaction performance.
- the block diagram of FIG. 1A includes client device 110 , network server 112 , application server 113 , backend servers 120 and 122 and application monitoring system 117 .
- Client device 110 and network server 112 communicate over network 111 .
- Network 120 may be implemented as a private or public network over which client 110 and network server 112 may communicate. In one embodiment, network 120 may be implemented as the Internet, an intranet, or some other network.
- servers 112 , 113 , 120 , 122 , and 117 may also communicate over a network similar to network 111 .
- Client device 110 may be implemented as a server, computing device or some other machine that sends requests to network server 112 .
- Network server 112 may provide a network service to client device 110 over network 111 .
- network server 112 may be implemented as a web server and implement a web service over the Internet.
- Network server 112 may receive a request from client device 110 , process the request and send a response to client device 110 .
- network server 112 may invoke an application on application server 113 . The invoked application will process the request, provide a response to network server 112 , and network server 112 will provide a corresponding response to client device 1110 .
- Application server 113 includes application 114 , application 115 and agent 116 . Though not illustrated in FIG. 1A , application server 113 may contain more or less than two applications and any application may be monitored by agent 116 or another agent. Applications 114 - 115 may process requests received from network server 112 . In some embodiments, either of applications 114 - 115 may process a request by receiving the request, generating a response and sending the response to network server 112 . In some embodiments, generating a response by an application may include sending a request to one or more of backend servers 120 or 122 . The application response is then generated based on a response received from the invoked backend server.
- Agent 116 generates performance data in response to monitoring execution of application 115 and provides the performance data to application monitoring system 117 . Generation of performance data is discussed in more detail below.
- Application monitoring system 117 processes performance data reported by agent 116 . In some embodiments, the processing of performance data includes providing backend health and/or performance information to a user through an interface. Application monitoring system 117 is discussed in more detail below with respect to FIG. 2B .
- Backend servers 120 - 122 may process requests from applications 114 - 115 of application server 113 .
- Each of backend servers 120 - 122 may be implemented as a database, another application server, or some other remote machine in communication with application server 113 that provides a service or may process requests from an application located on application server 113 .
- each of backend servers 120 - 122 may be implemented as a remote system that receives requests from an application, processes the request and provides a response.
- the backend could be another network service.
- FIG. 1B is an example of an interface for providing transaction performance information to a user for one or more applications.
- Interface 130 of FIG. 1B includes grid window 132 and information window 138 .
- Grid window 132 includes rows and columns of application performance information. Each row corresponds to an example application, such as applications 114 - 115 of FIG. 1A .
- the columns provide metric information and backend health information for each application.
- the columns include data for application response time (RT), error rate, and information health and/or performance information for example backends A and B accessed by an application.
- the response time column may indicate the time it takes a particular application to provide a response to network server 112 when the application is invoked.
- the error rate column may indicate a percentage that an application provides an error when processing a request.
- the columns with column headings backend A and backend B may provide health information for applications which use either backend.
- the rows of grid window 132 contain information for example applications A and application B.
- the data in the row for application A indicates that application A has a twelve second response time, a four percent (4%) error rate, that backend A exhibits a health concern level of low when processing application A requests (indicated by the icon 133 ) and backend B exhibits a health concern level of high when processing application A requests (indicated by icon 134 ).
- the data in the row corresponding to application B indicates that an application B response time of five seconds, an error rate of six percent (6%), that backend A is not invoked by application B (as indicated by the absence of a health icon) and backend B exhibits a health concern level of medium when processing application B requests (indicated by icon 136 ). Determining backend health and a corresponding health icon to use in grid window 132 is discussed in more detail below.
- Information window 138 of interface 130 provides information associated with application performance that a user may find helpful or of interest.
- the information provided in information window 138 may be automatically provided when a metric value is considerably different from an average metric, such as plus or minus thirty percent or more or some other value depending on the system, or the health of a backend or other system is not positive.
- information window 138 provides information that reads “application A has a current response time of 12 seconds and an average response time of 5 seconds.” Window 138 may provide information to a user which may be helpful in pointing out alerts or other unhealthy elements of an application.
- FIG. 1C is an example of a graph illustrating values of a metric over time for a particular application transaction.
- the graph of FIG. 1C has a series of prior data points plotted over time. The next data point is predicted based on the prior data points.
- the value of the predicted data point is used as a baseline from which one or more health levels (i.e., levels of deviation) are configured.
- the predicted data point may be determined from one or more functions as described in more detail below.
- the graph of FIG. 1C illustrates deviation ranges associated with the predicted data point.
- the next data point value i.e., the data point which follows the prior data points in FIG. 1C
- an icon is provided in grid window 132 of interface 130 .
- the corresponding icons provided within grid window 132 of interface 130 are shown in the corresponding deviation range of FIG. 1C with.
- range deviation indicators include a normal low level icon 133 , a medium level icon 136 and a high level icon 134 , indicating different levels of concern that correspond to the level of deviation of the data point from the predicted data point. Determining the level of deviation for a data point is discussed in more detail below with respect to FIGS. 3-7 .
- the technology herein can be used to monitor behavior of an application on an application server (or other server) using bytecode instrumentation.
- the technology herein may also be used to access information from the particular application.
- an application management tool may instrument the application's object code (also called bytecode).
- FIG. 2A depicts an exemplar process for modifying an application's bytecode.
- FIG. 2A shows Application 202 , Probe builder 204 , Application 115 with probes and Agent 116 .
- Application 115 includes probes used to access information from the application, and application 202 is the application before the probes are added.
- Application 202 can be a Java application or a different type of application.
- Probe builder 204 instruments (e.g. modifies) the bytecode for Application 202 to add probes and additional code to Application 202 in order to create Application 115 .
- the probes may measure specific pieces of information about the application without changing the application's business logic.
- Probe builder 204 also generates Agent 116 .
- Agent 116 may be installed on the same machine as Application 115 or a separate machine. Once the probes have been installed in the application bytecode, the application is referred to as a managed application. More information about instrumenting byte code can be found in U.S. Pat. No. 6,260,187 “System For Modifying Object Oriented Code” by Lewis K. Cirne, incorporated herein by reference in its entirety.
- the technology described herein doesn't actually modify source code. Rather, the present invention modifies object code.
- the object code is modified conceptually in the same manner that source code modifications are made. More information about such object code modification can be found in U.S. patent application Ser. No. 09/795,901, “Adding Functionality To Existing Code At Exits,” filed on Feb. 28, 2001, incorporated herein by reference in its entirety.
- FIG. 2B is a block diagram of a system for monitoring an application.
- the block diagram of FIG. 2B provides more information for managed application 115 and application monitoring system 117 of FIG. 1 .
- FIG. 2B is a conceptual view of the components of the application performance management tool.
- FIG. 2B also depicts Enterprise manager 210 , database 216 , workstation 212 and workstation 214 .
- probes e.g. 206 and/or 208
- Agent 116 may be implemented in objects and other code that write data, change data or otherwise cause the state of an application server to change.
- Agent 116 then collects, summarizes and sends the data to Enterprise Manager 210 .
- Enterprise Manager 210 receives performance data from managed applications via Agent 116 , runs requested calculations, makes performance data available to workstations 212 - 214 and optionally sends performance data to database 216 for later analysis.
- the workstations e.g. 212 and 214
- the workstations are the graphical user interface for viewing performance data.
- the workstations are used to create custom views of performance data which can be monitored by a human operator.
- the workstations consist of two main windows: a console and an explorer.
- the console displays performance data in a set of customizable views.
- the explorer depicts alerts and calculators that filter performance data so that the data can be viewed in a meaningful way.
- the elements of the workstation that organize, manipulate, filter and display performance data include actions, alerts, calculators, dashboards, persistent collections, metric groupings, comparisons, smart triggers and SNMP collections.
- other the natural language tool can be implemented in the console window, explorer window and other windows within an interface.
- each of the components is running on different machines. That is, workstation 212 is on a first computing device, workstation 214 is on a second computing device, Enterprise manager 210 is on a third computing device, and Managed Application 115 is running on a fourth computing device. In another embodiment, two or more (or all) of the components are operating on the same computing device. For example, Managed Application 115 and Agent 116 may be on a first computing device, Enterprise manager 210 on a second computing device and a workstation on a third computing device. Alternatively, all of the components of FIG. 2B can run on the same computing device.
- any or all of these computing devices can be any of various different types of computing devices, including personal computers, minicomputers, mainframes, servers, handheld computing devices, mobile computing devices, etc.
- these computing devices will include one or more processors in communication with one or more processor readable storage devices, communication interfaces, peripheral devices, etc.
- the storage devices include RAM, ROM, hard disk drives, floppy disk drives, CD ROMS, DVDs, flash memory, etc.
- peripherals include printers, monitors, keyboards, pointing devices, etc.
- Examples of communication interfaces include network cards, modems, wireless transmitters/receivers, etc.
- the system running the managed application can include a web server/application server.
- the system running the managed application may also be part of a network, including a LAN, a WAN, the Internet, etc.
- all or part of the invention is implemented in software that is stored on one or more processor readable storage devices and is used to program one or more processors.
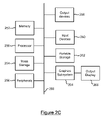
- FIG. 2C illustrates an embodiment of a computing system for use with the present technology.
- the system of FIG. 2C may be used to implement client device 110 , network server 112 , application server 113 , backend servers 120 - 122 , application monitoring system 117 , enterprise manager 210 , work stations 212 - 214 , and database 216 .
- the computer system of FIG. 2C includes one or more processors 250 and main memory 252 .
- Main memory 252 stores, in part, instructions and data for execution by processor unit 250 . If the system of the present invention is wholly or partially implemented in software, main memory 252 can store the executable code when in operation.
- the system of FIG. 2C further includes a mass storage device 254 , peripheral device(s) 256 , user input device(s) 260 , output devices 258 , portable storage medium drive(s) 262 , a graphics subsystem 264 and an output display 266 .
- the components shown in FIG. 2C are depicted as being connected via a single bus 268 . However, the components may be connected through one or more data transport means.
- processor unit 250 and main memory 252 may be connected via a local microprocessor bus, and the mass storage device 254 , peripheral device(s) 256 , portable storage medium drive(s) 262 , and graphics subsystem 64 may be connected via one or more input/output (I/O) buses.
- Mass storage device 254 which may be implemented with a magnetic disk drive or an optical disk drive, is a non-volatile storage device for storing data and instructions for use by processor unit 250 . In one embodiment, mass storage device 254 stores the system software for implementing the present invention for purposes of loading to main memory 252 .
- Portable storage medium drive 262 operates in conjunction with a portable non-volatile storage medium, such as a floppy disk, to input and output data and code to and from the computer system of FIG. 2C .
- the system software for implementing the present invention is stored on such a portable medium, and is input to the computer system via the portable storage medium drive 262 .
- Peripheral device(s) 256 may include any type of computer support device, such as an input/output (I/O) interface, to add additional functionality to the computer system.
- peripheral device(s) 256 may include a network interface for connecting the computer system to a network, a modem, a router, etc.
- User input device(s) 260 provides a portion of a user interface.
- User input device(s) 260 may include an alpha-numeric keypad for inputting alpha-numeric and other information, or a pointing device, such as a mouse, a trackball, stylus, or cursor direction keys.
- the computer system of FIG. 2C includes graphics subsystem 264 and output display 266 .
- Output display 266 may include a cathode ray tube (CRT) display, liquid crystal display (LCD) or other suitable display device.
- Graphics subsystem 264 receives textual and graphical information, and processes the information for output to display 266 .
- the system of FIG. 2C includes output devices 258 . Examples of suitable output devices include speakers, printers, network interfaces, monitors, etc.
- the components contained in the computer system of FIG. 2C are those typically found in computer systems suitable for use with the present invention, and are intended to represent a broad category of such computer components that are well known in the art.
- the computer system of FIG. 2C can be a personal computer, hand held computing device, telephone, mobile computing device, workstation, server, minicomputer, mainframe computer, or any other computing device.
- the computer can also include different bus configurations, networked platforms, multi-processor platforms, etc.
- Various operating systems can be used including Unix, Linux, Windows, Macintosh OS, Palm OS, and other suitable operating systems.
- the performance data provided by Agent 116 to Enterprise Manager 210 is collected during runtime for one or more applications.
- the application runtime data may include metric data for one or more applications in communication with one or more backend servers 120 - 122 (or remote machines, devices, or systems, not illustrated).
- the application runtime data i.e., performance data
- Response time for a backend is the time required by backend server 120 to process a request from application 115 .
- Processing by backend server 120 may include receiving an application request, processing the request to generate a response and providing the response to application 115 .
- the backend response time is measured at the application by agent 116 .
- the response time may be determined by agent 116 to be the difference between the time a request is sent by application 115 to backend 120 and the time a corresponding response is received by application 115 from backend 120 .
- Agent 116 may then generate backend response time data and include the data in performance data to be sent to application 115 .
- the performance data may differentiate backend performance with respect to each of one more applications that access the backend.
- backend server response time data may be reported in four ways: backend response time for backend server 120 when accessed by application 114 , backend response time for backend server 122 when accessed by application 114 , backend response time for backend server 120 when accessed by application 115 and backend response time for backend server 122 when accessed by application 115 .
- the performance data may “slice” or subdivide the response time data for a backend by each application that accesses the backend.
- the performance data may include several instances of response time data for each backend with respect to each application.
- performance data may be reported by Agent 116 periodically (such as every fifteen seconds or some other time period) with each reporting including a number of response times for each backend-application combination in communication with each other.
- the time series of response time data may indicate each request processed by a backend for a particular application.
- Error rate for a backend may be the rate at which requests sent by application 115 to backend 120 result in an error.
- An error may be reported to application 115 by backend server 120 and detected by agent 116 .
- Agent 116 may then generate backend error rate data (for example, errors per 100 or 1000 requests) and include the data in performance data to be sent to application 115 . Examples of errors include database is down, a requested data does not exist, a query is not formed property, and other errors.
- error rate may be reported once per application-backend combination per periodic reporting. A single error rate may be reported for each backend with respect to each application in each reporting of performance data.
- Stalls are conditions where a response is not provided by a backend to a requesting application within a certain period of time. Thus, if a backend does not provide a response within a threshold response time, the transaction can be considered a stall.
- Agent 116 may generate backend stall data (for example, stalls per 100 or 1000 requests) and include the stall data in performance data to be sent to application 115 .
- the reporting of stall information may be similar to that discussed above with respect to response time data. For example, stall data may be reported as a time series in each reporting of performance data for each application-backend relationship observed during the reporting period.
- the data is aggregated together.
- the particular aggregation function may differ according to the data type being aggregated. For example, multiple response time data points are averaged together while multiple error rate data points are summed.
- Response time, error rates and stalls are examples of the many metrics that can be monitored and reported using the present technology. Other metrics and data may be monitored, processed and reported as well, including connection pools, thread pools, CPU utilization, user roundtrip response time, user visible errors, user visible stalls, and others.
- FIG. 3 is a flow chart of an embodiment of a process for providing transaction performance information to a user.
- the process of FIG. 3 may be performed by application monitoring system 117 .
- Performance data is received at step 310 .
- the performance data may be received from agent 116 by Enterprise Manager 210 of system 117 .
- Performance data associated with a desired metric is then identified at step 320 .
- Enterprise manager 210 parses the received performance data and identifies a portion of the performance data to be processed.
- the identified data to be processed may be associated with backend performance indicators, include backend response time, error rates, stalls and other backend performance data.
- Enterprise Manager 210 may perform parsing to identify performance data that associates a URL or network server request to an application and a backend that eventually processes the URL or network server request.
- the data identified by Enterprise Manager 210 and associated with the desired metrics may be generated by agent 116 in response to tracing application transactions.
- agent 116 may leverage a Blame technology in a managed Java Application identify component interactions and component resource usage. Blame technology tracks specified components using concepts of consumers and resources. Consumers request some activity while resources perform the activity. In some cases, a component can be both a consumer and a resource, depending on the context and the operations it performs.
- consumer and resources are reported in a tree-like manner by agent 116 in a stack called a Blame Stack.
- agent 116 When transactions are started, they are pushed onto the stack. When transactions are completed, they are popped off the stack.
- Sub-elements are Blame Stack entries for other components (e.g. methods, process, procedure, function, thread, set of instructions, etc.) that are started from within the transaction of interest.
- the transaction tracing and blame technology may be used to associate a URL request (or other network server request) received by an application with corresponding calls made by the application to one or more backends to process the URL request.
- network server 112 when implemented as a web server, may receive a request for a URL that requires processing by application 115 of application server 113 .
- Web server 112 may send a request to application 115 to process the URL request.
- application 115 may first process the request by a servlet (component A), which then invokes an Enterprise Java Bean (EJB) (component B), which invokes another EJB (component C), which places a call to backend 120 .
- EJB Enterprise Java Bean
- component C which places a call to backend 120 .
- a URL request is received by component A, which then invokes component B, which invokes component C which then invokes a backend server.
- component A-C are contained within an application such as application 115 .
- application 115 Using boundary blame technology to trace the transaction, the transaction processing can be represented as
- agent 116 can be implemented in agent 116 to identify what URL requests are eventually processed by a particular backend.
- agent 116 may report data in string format such as the pseudo-data below:
- Application A is the application that received URL request B from a network server
- backend C is called by application A to process the request
- the average error rate over a period T for example, 15 seconds
- Other metrics such as response time, stalls, and others may be used as well.
- the performance data can have many formats, and the pseudo-data string above is only an example of one of many possible formats for reporting metrics.
- the identified data is aggregated into data sets by application and the first data set is selected at step 330 .
- the data set may comprise a time series of data, such as a series of response times that take place over time.
- the data sets may be aggregated by URL rather than application, with one dataset per URL.
- Baseline deviation information is calculated and provided to a user for a data set at step 340 .
- step 340 includes predicting a value (i.e., a baseline) for each data point in the data set, determining a deviation of the actual data point value from the predicted data point value, providing the deviation information for the data point to a user and repeating the process for the remaining data points in the data set.
- Providing baseline deviation information to a user for a data set is discussed in more detail below with respect to FIG. 4 .
- FIG. 4 illustrates a flow chart of an embodiment of a process for calculating and providing baseline deviation information to a user.
- the process of FIG. 4 provides more detail for step 340 of the process of FIG. 3 .
- two or more functions are fit to the selected data set at step 405 .
- the first data set for a particular metric is used to fit functions to the data.
- the first data set may not necessarily be used to determine a baseline for data points within the data set.
- data points in every data set may be processed using two or more functions to determine a baseline and the first data set is not used solely to fit functions to the data type.
- the functions once the functions are selected for the first data set, they may be used in subsequent data sets as well.
- a different set of functions may be used for different data sets, such as data sets associated with a different application or a different metric.
- step 405 is optional as indicated by the dash lines comprising this step.
- Fitting functions to a data set may include determining function constants.
- the constants may be determined from the first data set and enable each function to be fit to the first data set.
- fitting two or more functions may include selecting the functions from a group of functions. For example, the five (or some other number) best fitting functions which best fit the first data set may be selected from a group of ten functions.
- a first data point is selected in the selected data set at step 410 .
- a baseline for the selected data point is then determined by predicting the value of the data point at step 420 .
- the data point value is predicted based on previous data values in the data set or a previous data set in previous performance data. Determining a baseline for a selected data point by predicting a data point value is discussed in more detail below with respect to the process of FIG. 5 .
- a deviation for the data point is then determined at step 430 .
- determining the deviation includes determining how far the actual data point value differs from the predicted data point value determined at step 420 .
- the deviation may be determined as a Boolean value, a range of values, or in some other manner. Determining a deviation for a data point is discussed in more detail below with respect to FIGS. 6A-6C .
- Deviation information is provided to a user at step 440 .
- the deviation information is provided to a user through an interface such as that illustrated in FIG. 1B .
- the deviation information may be provided in a grid, an information window, as an alert, email, page, in a file, to another application or process, or in some other manner.
- the deviation information may provide health information of backend systems that process application requests.
- a determination is made as to whether more data points within the data set should be processed at step 450 . If no more data points exist in the current data set being processed, the process of FIG. 4 is done at step 470 . If more data points exist in the data set, the next data point is selected at step 460 and the method of FIG. 4 returns to step 420 where baseline data is determined for the currently selected data point.
- FIG. 5 is a flow chart of an embodiment of a process for predicting a data point value.
- the process of FIG. 5 provides more detail for step 420 of the process of FIG. 4 .
- a first function is loaded at step 550 .
- the function may be one of a set of several functions used to predict the data point value.
- the set of functions can include different types of functions, the same function type tuned with different constants, or a combination of these.
- N is the last point received and N+1 is the next data point to be processed.
- the data point counter may be maintained by Enterprise Manager 210 .
- a predicted value for the Nth data point (formerly the N+1 data point) is computed for the selected function at step 560 . Computing the predicted value may be done using any of several functions as discussed above with respect to step 405 of the process of FIG. 4 .
- FIGS. 6A-6C illustrate different embodiments for determining deviation information for a data point.
- the processes of FIGS. 6A-6C each provide an example of more detail for step 430 of FIG. 4 .
- the different embodiments may determine deviation information using a different number of functions, use different methods for selecting a deviation range, and differ in other ways. These illustrated embodiments are intended as examples of possible implementations and other embodiments for determining deviation information are within the scope of the present technology.
- FIG. 6A is a flow chart of an embodiment of a process for determining deviation level for a data point. The embodiment described by the process of FIG. 6A uses one function to determine the deviation of an actual data point from an expected data point.
- a predicted value for a function is accessed for the next data point at step 604 .
- the predicted value is determined by the process described above with respect to FIG. 5 .
- the actual data point value is compared to the accessed value at step 606 .
- a determination is then made as to whether the difference between the actual data point value and the predicted data point value is within a low deviation range at step 608 .
- a low deviation range has a small deviation, if any, and is the range associated with low level icon 133 in FIG. 1C discussed above.
- the low range may be configured as up to 10% deviation of the predicted value, a standard deviation from the data points in the data series, or some other range selected by a user. In some embodiments, the range may be determined automatically by the system herein. If the data point difference is within the low deviation range at step 608 , the deviation is set to low at step 610 and the process of FIG. 6A ends at step 618 .
- a medium range may be configured as between 10% and 20% deviation of the predicted value, between the standard deviation and twice the standard deviation, or some other range of values.
- the medium range is associated with icon 136 in FIG. 1C . If the deviation is within a medium range, the deviation for the data point is set to medium at step 614 and the process of FIG. 6A ends at step 618 . If the deviation is not within the medium range at step 612 , the deviation is shut to a high range at step 616 the process of FIG. 6A ends at step 618 .
- the high deviation range is associated with icon 134 in FIG. 1C .
- FIG. 6B illustrates a flow chart of an embodiment of a process for determining deviation count for data point.
- the process of FIG. 6B provides more detail for step 430 of the process of FIG. 4 .
- a count is set to zero at step 620 .
- the count represents a number of times that a data point value falls outside the low deviation threshold associated with each predicted data point value.
- a predicted value of a data point associated with a first function is accessed at step 622 .
- the actual data point value is compared to the accessed data point value at step 624 .
- the accessed data point value is the value predicted in the process of FIG. 5 .
- the threshold may be the limit of a low deviation range, such as 10% of the predicted value, a standard deviation, or some other value. If the deviation is not within the threshold, the count is incremented at step 628 . After incrementing the count, the process continues to step 630 . If the deviation is within the threshold, the process of FIG. 6B continues to step 630 .
- FIG. 6C illustrates a flow chart of an embodiment of a process for determining deviation notification for a data point.
- the process of FIG. 6C provides more detail for step 430 for the process of FIG. 4 .
- two or more counts are set to zero at step 640 .
- a count is used for each of a low deviation range, medium deviation range and high deviation range.
- the counts are used to keep track of the number of actual data point values that differ by the corresponding deviation (low, medium, high) from their predicted data point value.
- a predicted value for a first function is accessed at step 642 .
- the predicted data point value is the value predicted by the process of FIG. 5 .
- the actual data point value is compared to the accessed value associated at step 644 .
- the counts are processed to determine the overall deviation at step 658 .
- the count (of the low, medium and high count) which has the largest value is selected as the corresponding range associated with the data point.
- the process of FIG. 6C is then complete at step 660 .
- a count may be incremented by a value greater than one in the embodiments of FIGS. 6B-6C or other embodiments that use counts.
- a process may be used to weight the increment value when a particular function is trusted or more closely resembles a time series than other functions used to predict values of the time series. For example, if a function appears to represent a time series with a low deviation for a certain period of time, the increment value for the function may be weighted to increment a counter more than normal if the actual data point value differs from the predicted data point value.
- the increment associated with a function may be weighted if the difference calculated between the last hundred (or some other number) actual data points and the data points predicted by a function has been less than a threshold value.
- a determination may identify whether the function has a history of accurately predicting values for the times series.
- the anomaly detection system may be configured to utilize different functions at activity periods or to adjust the functions to better approximate the changed time series as the application activity changes. This “normalization” of the system may be used to reduce false alarms that may appear as a deviation of concern but are actually just a reflection of expected increased activity or load on an application or the particular backend.
- FIG. 7 is a flow chart of an embodiment of a process for providing baseline deviation information to a user.
- the process of FIG. 7 is performed concurrently with the process of FIG. 4 .
- a graphic user interface (GUI) form is provided at step 710 .
- the GUI form will provide performance data and deviation information to the user.
- the GUI may be implemented as the interface of FIG. 1B .
- Performance data is accessed at step 720 .
- the accessed performance data may relate to application response time, error rate, availability rate, and other information for the application.
- the GUI is populated with the accessed performance data at step 730 .
- a grid with the GUI is populated with the accessed performance data.
- Deviation information for a first application is accessed at step 740 .
- deviation information for other applications is not accessed at this time.
- the accessed deviation information is generated in one of the processes of FIG. 6A-6C .
- the deviation information may include one string, a string of data for each backend, or information in some other format indicating the health level of one or more backends in communication with the currently selected application.
- steps 750 and 760 provide more detail for step 440 of FIG. 4 .
- step 770 A determination is made at step 770 as to whether more applications exist in the GUI to be processed for deviation information. If no further applications are listed in the GUI, the process of FIG. 7 is done at step 780 . If additional applications are listed in the GUI, the deviation information for the next application is accessed at step 790 and the process of FIG. 7 continues to step 750 .
Abstract
Description
Claims (35)
Priority Applications (1)
| Application Number | Priority Date | Filing Date | Title |
|---|---|---|---|
| US11/559,755 US7673191B2 (en) | 2006-11-03 | 2006-11-14 | Baselining backend component error rate to determine application performance |
Applications Claiming Priority (2)
| Application Number | Priority Date | Filing Date | Title |
|---|---|---|---|
| US86436306P | 2006-11-03 | 2006-11-03 | |
| US11/559,755 US7673191B2 (en) | 2006-11-03 | 2006-11-14 | Baselining backend component error rate to determine application performance |
Publications (2)
| Publication Number | Publication Date |
|---|---|
| US20080126413A1 US20080126413A1 (en) | 2008-05-29 |
| US7673191B2 true US7673191B2 (en) | 2010-03-02 |
Family
ID=39495349
Family Applications (1)
| Application Number | Title | Priority Date | Filing Date |
|---|---|---|---|
| US11/559,755 Active 2028-05-19 US7673191B2 (en) | 2006-11-03 | 2006-11-14 | Baselining backend component error rate to determine application performance |
Country Status (1)
| Country | Link |
|---|---|
| US (1) | US7673191B2 (en) |
Cited By (6)
| Publication number | Priority date | Publication date | Assignee | Title |
|---|---|---|---|---|
| US20080221911A1 (en) * | 2007-03-09 | 2008-09-11 | Ludmila Cherkasova | System and method for determining a subset of transactions of a computing system for use in determining resource costs |
| US20090119301A1 (en) * | 2007-11-05 | 2009-05-07 | Ludmila Cherkasova | System and method for modeling a session-based system with a transaction-based analytic model |
| US20110098973A1 (en) * | 2009-10-23 | 2011-04-28 | Computer Associates Think, Inc. | Automatic Baselining Of Metrics For Application Performance Management |
| US8302079B2 (en) | 2007-06-05 | 2012-10-30 | Ca, Inc. | Programmatic root cause analysis for application performance management |
| US20160306670A1 (en) * | 2015-04-15 | 2016-10-20 | International Business Machines Corporation | Dynamically choosing data to collect in a system |
| US20180270128A1 (en) * | 2017-03-20 | 2018-09-20 | International Business Machines Corporation | Analyzing performance and capacity of a complex storage environment for predicting failure |
Families Citing this family (15)
| Publication number | Priority date | Publication date | Assignee | Title |
|---|---|---|---|---|
| US7937690B2 (en) * | 2006-05-23 | 2011-05-03 | Hewlett-Packard Development Company, L.P. | Evaluating performance of software application |
| JP4893325B2 (en) * | 2007-01-17 | 2012-03-07 | 富士通株式会社 | SYSTEM ANALYSIS PROGRAM, RECORDING MEDIUM CONTAINING THE PROGRAM, SYSTEM ANALYSIS METHOD, AND SYSTEM ANALYSIS DEVICE |
| EP2350933A4 (en) * | 2008-10-16 | 2012-05-23 | Hewlett Packard Development Co | Performance analysis of applications |
| US8326680B2 (en) * | 2010-05-12 | 2012-12-04 | International Business Machine Corporation | Business activity monitoring anomaly detection |
| US20120266026A1 (en) * | 2011-04-18 | 2012-10-18 | Ramya Malanai Chikkalingaiah | Detecting and diagnosing misbehaving applications in virtualized computing systems |
| DE102011089397B4 (en) * | 2011-12-21 | 2020-12-17 | Bayerische Motoren Werke Aktiengesellschaft | Method for monitoring an adaptive network |
| TWI480730B (en) | 2011-12-30 | 2015-04-11 | Ibm | Method and apparatus for measuring performance of an appliance |
| US20140012738A1 (en) * | 2012-07-09 | 2014-01-09 | Bennett Woo | Methods and systems for measuring accuracy in fraudulent transaction identification |
| US20140149574A1 (en) * | 2012-11-28 | 2014-05-29 | Hewlett-Packard Development Company, L.P. | Generating a generalized uniform resource identifier |
| US10229028B2 (en) | 2015-03-16 | 2019-03-12 | Ca, Inc. | Application performance monitoring using evolving functions |
| US9760467B2 (en) | 2015-03-16 | 2017-09-12 | Ca, Inc. | Modeling application performance using evolving functions |
| US10102055B1 (en) * | 2016-03-22 | 2018-10-16 | EMC IP Holding Company LLC | Data driven converged infrastructure components evaluation |
| JP6753265B2 (en) * | 2016-10-19 | 2020-09-09 | 富士通株式会社 | Display control programs, devices, and methods |
| US10437704B2 (en) | 2016-11-22 | 2019-10-08 | Ca, Inc. | Identifying back-end components based on stack traces |
| US10860400B2 (en) * | 2018-07-31 | 2020-12-08 | EMC IP Holding Company LLC | Intelligent monitoring and diagnostics for application support |
Citations (13)
| Publication number | Priority date | Publication date | Assignee | Title |
|---|---|---|---|---|
| US5958009A (en) * | 1997-02-27 | 1999-09-28 | Hewlett-Packard Company | System and method for efficiently monitoring quality of service in a distributed processing environment |
| US6182022B1 (en) * | 1998-01-26 | 2001-01-30 | Hewlett-Packard Company | Automated adaptive baselining and thresholding method and system |
| US6327677B1 (en) * | 1998-04-27 | 2001-12-04 | Proactive Networks | Method and apparatus for monitoring a network environment |
| US20020174421A1 (en) * | 2001-03-30 | 2002-11-21 | Zhao Ling Z. | Java application response time analyzer |
| US20040088406A1 (en) * | 2002-10-31 | 2004-05-06 | International Business Machines Corporation | Method and apparatus for determining time varying thresholds for monitored metrics |
| US20050065753A1 (en) * | 2003-09-24 | 2005-03-24 | International Business Machines Corporation | Apparatus and method for monitoring system health based on fuzzy metric data ranges and fuzzy rules |
| US7050936B2 (en) * | 2001-09-06 | 2006-05-23 | Comverse, Ltd. | Failure prediction apparatus and method |
| US7076695B2 (en) * | 2001-07-20 | 2006-07-11 | Opnet Technologies, Inc. | System and methods for adaptive threshold determination for performance metrics |
| US7197559B2 (en) * | 2001-05-09 | 2007-03-27 | Mercury Interactive Corporation | Transaction breakdown feature to facilitate analysis of end user performance of a server system |
| US7280988B2 (en) * | 2001-12-19 | 2007-10-09 | Netuitive, Inc. | Method and system for analyzing and predicting the performance of computer network using time series measurements |
| US7286962B2 (en) * | 2004-09-01 | 2007-10-23 | International Business Machines Corporation | Predictive monitoring method and system |
| US20080306711A1 (en) | 2007-06-05 | 2008-12-11 | Computer Associates Think, Inc. | Programmatic Root Cause Analysis For Application Performance Management |
| US7467067B2 (en) * | 2006-09-27 | 2008-12-16 | Integrien Corporation | Self-learning integrity management system and related methods |
-
2006
- 2006-11-14 US US11/559,755 patent/US7673191B2/en active Active
Patent Citations (13)
| Publication number | Priority date | Publication date | Assignee | Title |
|---|---|---|---|---|
| US5958009A (en) * | 1997-02-27 | 1999-09-28 | Hewlett-Packard Company | System and method for efficiently monitoring quality of service in a distributed processing environment |
| US6182022B1 (en) * | 1998-01-26 | 2001-01-30 | Hewlett-Packard Company | Automated adaptive baselining and thresholding method and system |
| US6327677B1 (en) * | 1998-04-27 | 2001-12-04 | Proactive Networks | Method and apparatus for monitoring a network environment |
| US20020174421A1 (en) * | 2001-03-30 | 2002-11-21 | Zhao Ling Z. | Java application response time analyzer |
| US7197559B2 (en) * | 2001-05-09 | 2007-03-27 | Mercury Interactive Corporation | Transaction breakdown feature to facilitate analysis of end user performance of a server system |
| US7076695B2 (en) * | 2001-07-20 | 2006-07-11 | Opnet Technologies, Inc. | System and methods for adaptive threshold determination for performance metrics |
| US7050936B2 (en) * | 2001-09-06 | 2006-05-23 | Comverse, Ltd. | Failure prediction apparatus and method |
| US7280988B2 (en) * | 2001-12-19 | 2007-10-09 | Netuitive, Inc. | Method and system for analyzing and predicting the performance of computer network using time series measurements |
| US20040088406A1 (en) * | 2002-10-31 | 2004-05-06 | International Business Machines Corporation | Method and apparatus for determining time varying thresholds for monitored metrics |
| US20050065753A1 (en) * | 2003-09-24 | 2005-03-24 | International Business Machines Corporation | Apparatus and method for monitoring system health based on fuzzy metric data ranges and fuzzy rules |
| US7286962B2 (en) * | 2004-09-01 | 2007-10-23 | International Business Machines Corporation | Predictive monitoring method and system |
| US7467067B2 (en) * | 2006-09-27 | 2008-12-16 | Integrien Corporation | Self-learning integrity management system and related methods |
| US20080306711A1 (en) | 2007-06-05 | 2008-12-11 | Computer Associates Think, Inc. | Programmatic Root Cause Analysis For Application Performance Management |
Non-Patent Citations (3)
| Title |
|---|
| Notice of Allowance and Fee(s) Due Dated Nov. 17, 2009 in U.S. Appl. No. 11/559,750. |
| Office Action dated May 5, 2009 in U.S. Appl. No. 11/559,750. |
| Response to Office Action filed Aug. 5, 2009 in U.S. Appl. No. 11/559,750. |
Cited By (12)
| Publication number | Priority date | Publication date | Assignee | Title |
|---|---|---|---|---|
| US20080221911A1 (en) * | 2007-03-09 | 2008-09-11 | Ludmila Cherkasova | System and method for determining a subset of transactions of a computing system for use in determining resource costs |
| US7779127B2 (en) * | 2007-03-09 | 2010-08-17 | Hewlett-Packard Development Company, L.P. | System and method for determining a subset of transactions of a computing system for use in determing resource costs |
| US8302079B2 (en) | 2007-06-05 | 2012-10-30 | Ca, Inc. | Programmatic root cause analysis for application performance management |
| US20090119301A1 (en) * | 2007-11-05 | 2009-05-07 | Ludmila Cherkasova | System and method for modeling a session-based system with a transaction-based analytic model |
| US8326970B2 (en) | 2007-11-05 | 2012-12-04 | Hewlett-Packard Development Company, L.P. | System and method for modeling a session-based system with a transaction-based analytic model |
| US20110098973A1 (en) * | 2009-10-23 | 2011-04-28 | Computer Associates Think, Inc. | Automatic Baselining Of Metrics For Application Performance Management |
| US20160306670A1 (en) * | 2015-04-15 | 2016-10-20 | International Business Machines Corporation | Dynamically choosing data to collect in a system |
| US20160306669A1 (en) * | 2015-04-15 | 2016-10-20 | International Business Machines Corporation | Dynamically choosing data to collect in a system |
| US9852042B2 (en) * | 2015-04-15 | 2017-12-26 | International Business Machines Corporation | Dynamically choosing data to collect in a system |
| US9864670B2 (en) * | 2015-04-15 | 2018-01-09 | International Business Machines Corporation | Dynamically choosing data to collect in a system |
| US20180270128A1 (en) * | 2017-03-20 | 2018-09-20 | International Business Machines Corporation | Analyzing performance and capacity of a complex storage environment for predicting failure |
| US10771369B2 (en) * | 2017-03-20 | 2020-09-08 | International Business Machines Corporation | Analyzing performance and capacity of a complex storage environment for predicting expected incident of resource exhaustion on a data path of interest by analyzing maximum values of resource usage over time |
Also Published As
| Publication number | Publication date |
|---|---|
| US20080126413A1 (en) | 2008-05-29 |
Similar Documents
| Publication | Publication Date | Title |
|---|---|---|
| US7676706B2 (en) | Baselining backend component response time to determine application performance | |
| US7673191B2 (en) | Baselining backend component error rate to determine application performance | |
| US7797415B2 (en) | Automatic context-based baselining for transactions | |
| US8261278B2 (en) | Automatic baselining of resource consumption for transactions | |
| US7310590B1 (en) | Time series anomaly detection using multiple statistical models | |
| US7634590B2 (en) | Resource pool monitor | |
| US8612573B2 (en) | Automatic and dynamic detection of anomalous transactions | |
| US20110098973A1 (en) | Automatic Baselining Of Metrics For Application Performance Management | |
| US8402468B2 (en) | Capacity planning based on resource utilization as a function of workload | |
| US7912947B2 (en) | Monitoring asynchronous transactions within service oriented architecture | |
| US9021505B2 (en) | Monitoring multi-platform transactions | |
| US7953847B2 (en) | Monitoring and management of distributing information systems | |
| US10229028B2 (en) | Application performance monitoring using evolving functions | |
| US11281565B1 (en) | Processing data streams received from instrumented software in real time using incremental-decremental implementation of the KPSS stationarity statistic | |
| US20050065753A1 (en) | Apparatus and method for monitoring system health based on fuzzy metric data ranges and fuzzy rules | |
| US20160224400A1 (en) | Automatic root cause analysis for distributed business transaction | |
| JP2002342128A (en) | Method to extract health of service from host machine | |
| US9760467B2 (en) | Modeling application performance using evolving functions | |
| US7860860B2 (en) | Navigation of interrelated hierarchies for application performance data | |
| CN113342559A (en) | Diagnostic framework in a computing system | |
| US10942832B2 (en) | Real time telemetry monitoring tool | |
| US7752303B2 (en) | Data reporting using distribution estimation | |
| US20080071807A1 (en) | Methods and systems for enterprise performance management | |
| KR100221375B1 (en) | Method and apparatus for detecting performance problems in a computer system | |
| Kubacki et al. | Exploring operational profiles and anomalies in computer performance logs |
Legal Events
| Date | Code | Title | Description |
|---|---|---|---|
| AS | Assignment |
Owner name: COMPUTER ASSOCIATES THINK, INC., NEW YORK Free format text: ASSIGNMENT OF ASSIGNORS INTEREST;ASSIGNORS:ADDLEMAN, MARK JACOB;SEIDMAN, DAVID ISAIAH;BLEY, JOHN B.;AND OTHERS;REEL/FRAME:018533/0924 Effective date: 20061114 Owner name: COMPUTER ASSOCIATES THINK, INC.,NEW YORK Free format text: ASSIGNMENT OF ASSIGNORS INTEREST;ASSIGNORS:ADDLEMAN, MARK JACOB;SEIDMAN, DAVID ISAIAH;BLEY, JOHN B.;AND OTHERS;REEL/FRAME:018533/0924 Effective date: 20061114 |
|
| STCF | Information on status: patent grant |
Free format text: PATENTED CASE |
|
| FEPP | Fee payment procedure |
Free format text: PAYOR NUMBER ASSIGNED (ORIGINAL EVENT CODE: ASPN); ENTITY STATUS OF PATENT OWNER: LARGE ENTITY Free format text: PAYER NUMBER DE-ASSIGNED (ORIGINAL EVENT CODE: RMPN); ENTITY STATUS OF PATENT OWNER: LARGE ENTITY |
|
| AS | Assignment |
Owner name: CA, INC., NEW YORK Free format text: MERGER;ASSIGNOR:COMPUTER ASSOCIATES THINK, INC.;REEL/FRAME:028047/0913 Effective date: 20120328 |
|
| FPAY | Fee payment |
Year of fee payment: 4 |
|
| SULP | Surcharge for late payment | ||
| FPAY | Fee payment |
Year of fee payment: 8 |
|
| MAFP | Maintenance fee payment |
Free format text: PAYMENT OF MAINTENANCE FEE, 12TH YEAR, LARGE ENTITY (ORIGINAL EVENT CODE: M1553); ENTITY STATUS OF PATENT OWNER: LARGE ENTITY Year of fee payment: 12 |