US7629986B2 - Motion-based visualization - Google Patents
Motion-based visualization Download PDFInfo
- Publication number
- US7629986B2 US7629986B2 US11/961,242 US96124207A US7629986B2 US 7629986 B2 US7629986 B2 US 7629986B2 US 96124207 A US96124207 A US 96124207A US 7629986 B2 US7629986 B2 US 7629986B2
- Authority
- US
- United States
- Prior art keywords
- data
- layer
- motion
- layers
- processor
- Prior art date
- Legal status (The legal status is an assumption and is not a legal conclusion. Google has not performed a legal analysis and makes no representation as to the accuracy of the status listed.)
- Expired - Lifetime
Links
Images


Classifications
-
- G—PHYSICS
- G06—COMPUTING; CALCULATING OR COUNTING
- G06F—ELECTRIC DIGITAL DATA PROCESSING
- G06F11/00—Error detection; Error correction; Monitoring
- G06F11/30—Monitoring
- G06F11/32—Monitoring with visual or acoustical indication of the functioning of the machine
- G06F11/323—Visualisation of programs or trace data
-
- G—PHYSICS
- G06—COMPUTING; CALCULATING OR COUNTING
- G06T—IMAGE DATA PROCESSING OR GENERATION, IN GENERAL
- G06T11/00—2D [Two Dimensional] image generation
- G06T11/20—Drawing from basic elements, e.g. lines or circles
- G06T11/206—Drawing of charts or graphs
Definitions
- the present invention is directed to data display. It particularly concerns effectively displaying high-dimensional and complex relational data.
- hyperspectral data typically, such data are similar to those that result from a camera in the sense that the domain is usually a two-dimensional scene.
- the value taken for each picture element (“pixel”) in the scene is not a vector representing visible-color components, such as red, green, and blue or cyan, magenta, and yellow. Instead, it is a vector consisting of a relatively large number of components, each of which typically represents some aspect of the radiation received from a respective wave-length band. And the bands often fall outside the visual range. Because of the data's high dimensionality and the limited dimensionality of human visual perception, some degree of selectivity in data presentation is unavoidable, and the decisions that are involved in making the selections have a significant impact on the presentation's usefulness to the human viewer.
- data objects may represent respective individual people, and the dimensions may be age, gender, height, weight, income, etc.
- nodes on a display represent various entities, and lines connecting the nodes represent various relationships between them.
- the nodes may be, say, Internet Protocol (“IP”) routers, and the lines would represent the interconnecting communication links.
- IP Internet Protocol
- the nodes may represent people, organizations, buildings, or other entities under surveillance, while the lines may represent known communications between the entities or represent other relationships, such as ownership, legal control, etc. If the amount of data being presented is large, the resulting diagram can be hard to comprehend even if the underlying data dimensionality is low.
- presentation systems have provided features that make important patterns “stand out” from the other data represented.
- some link-analysis systems employ color, thickness, etc. to highlight the nodes and/or relationships that meet criteria of particular interest.
- a similar approach is commonly used in “brushing,” which is sometimes used when representations of the same data objects are displayed simultaneously in different relative locations in different displays. (The displays can be on the screens of different monitors, for example, or on different parts of a single monitor's screen).
- brushing a user employs a mouse or other device to select a subset of the objects represented by icons in one display, and the display system highlights other display's objects that represent the same objects.
- this technique can be adapted to link-analysis systems. Specifically, by imparting distinctive motion to chosen nodes in a node-link or similar display, we distinguish them from other nodes. Thus using motion instead of, say, color to highlight those nodes tends to make their membership in the criterion-satisfying subset apparent to the human user without obscuring other information that the display contains. We also apply this approach to brushing.
- FIG. 1 is a block diagram of a computer system in which the present invention's teachings may be implemented
- FIG. 2 is diagram of a display of the type often employed for link analysis
- FIG. 3 is a diagram that illustrates the result of using such a display in accordance with one of the invention's aspects
- FIG. 4 depicts exemplary histograms in which brushing is being performed
- FIGS. 5A , 5 B, and 5 C are plots of one component of the motion of a body that represents a data object in accordance with the present invention.
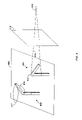
- FIG. 6 is a diagram that illustrates one kind of three-dimensional body in whose features an object's data can be encoded in accordance with one of the invention's aspects;
- FIG. 7 is a flow chart of the manner in which one embodiment of the invention operates.
- FIG. 8 is a diagram that illustrates one way in which a display can be generated from three-dimensional models that represent data objects in accordance with one of the present invention's aspects
- FIG. 9 depicts a small segment of a display generated by projecting such models
- FIG. 10 depicts a larger segment of such a display.
- FIGS. 11A-11C are illustrative outputs of a geographic information system (GIS), according to an illustrative embodiment
- FIGS. 12A and 12B depict simulated outputs of an X-ray screening machine, according to an illustrative embodiment
- FIGS. 13A and 13B depict the output of a data visualization system integrated with a viewfinder, according to an illustrative embodiment.
- FIG. 1 corresponds to a data visualization system 100 .
- the data visualization system 100 includes a processor 112 , which operates in accordance with instructions loaded into a memory 114 .
- the instructions will ordinarily have been loaded into the memory from a computer readable medium such as local persistent storage in the form of, say, a disc drive 116 with which the memory communicates by way of a local bus 118 .
- the instructions may additionally or instead be received by way of a communications interface 120 from a remote instruction source, which would usually be some sort of persistent storage, too.
- the disc drive 116 may also store image data for presentation by the data visualization system 100 on a local or remote monitor 126 .
- the system may also receive user input from devices such as a keyboard 122 or mouse 124 .
- the instructions indicate to the processor how it is to operate on data typically received in ways similar to those in which the instructions are. In accordance with some of those data operations, the instructions cause the processor to present some of the data to one or more human users by driving some type of display, such as the local monitor 126 .
- the present invention's teachings can be applied to representing a wide variety of data objects.
- One of the invention's aspects is particularly applicable to data that specify various types of relationships between data objects that the data also represent.
- the data may represent the results of criminal investigations: certain of the data objects may represent surveillance targets such as people, buildings, or businesses. Of particular interest in the context of link analysis, some of the objects may include references to other objects.
- FIG. 2 illustrates in a simplified manner how the system may present the objects in a display for link analysis.
- Each of the nodes 204 , 206 , 208 , 210 , 212 , and 214 represents a different data object.
- the drawing employs more than one style of icon to represent the nodes. This is not a necessary feature of the invention, but thus varying the icon type is one way to impart additional information.
- the objects represent surveillance targets, for example, one of each object's fields may indicate what type of target it is, e.g., whether the target is a person, a building, a business, etc. If so, the types of icons placed at those nodes can represent that aspect of the object's contents.
- the icons at nodes 204 , 206 , and 208 represent people, those at nodes 210 and 212 represent corporations, and those at nodes 214 and 216 represent buildings.
- a display feature such as icon shape can be used to represent one of the data's dimensions.
- Another dimension such as the priority assigned to the target's surveillance, may be represented by the icon's color.
- the nodes' locations on the display are essentially arbitrary in some link-analysis applications, they represent some aspect of the data, such as the target's geographical location, in others.
- each object may include fields whose contents represent relationships to other data objects or represent pointers to arrays of such fields.
- Such a field may include, say, a pointer or handle to the object linked by the represented relationship and may also include information about the relationship's type.
- the display's lines represent those relationships, and, in this example, the line style conveys information, too.
- line 218 which is relatively thin, represents the fact that the target represented by node 206 has communicated by telephone with the target that node 208 represents.
- line 220 which is thicker, indicates that target 206 owns target 214 .
- Other types of relationships may be represented by dashed lines, arc-shaped lines, etc.
- FIG. 2 shows only a few nodes and lines. In most situations to which graphical link analysis is applied, though, the number of nodes and lines is much greater, so the display is often difficult to comprehend.
- the system selectively moves icons for this purpose.
- the user wants to see all targets that satisfy some criterion.
- the criterion that the target has to be within two communications links from a base target. The user may have chosen the base target by, say, “clicking” on it.
- the display system causes their icons to move.
- FIG. 3 illustrates this.
- Cursor 302 represents the user's choosing node 304 , and the dashed lines represent the resultant motion of nodes 306 , 308 , and 310 , which satisfy that criterion. In most displays, the lines connected to the nodes will “rubber band,” i.e., will so stretch with the node movement as to remain connected despite that motion.
- That example uses a direct form of user input: the user employs a mouse to select one of the targets. But link analysis does not always require that type of input.
- the criterion may be that motion is imparted to nodes representing all targets owned by high-priority targets; i.e., the selection is totally data driven.
- This approach to representing the data is advantageous because, although the user could, by careful attention, identify the targets that are within two communications links of the chosen target, making them move causes them to “jump out” at the viewer, and it can do so without, say, changing any colors and thereby obscuring originally presented information.
- a similar approach can be applied to what is often termed “brushing,” which is a technique often employed when multidimensional data are presented in more than one display simultaneously.
- the axes in one display may represent one pair of the data components, while those in a different display may represent a different pair.
- at least one of the displays is an income histogram in which each of the bars is considered to be a stack of icons representing respective people whose incomes belong to the corresponding income range, while another display is an age histogram of the same people.
- one or more of the diagrams is a cluster diagram: icons representing different objects are clustered together in accordance with some similarity metric computed as some function of the objects' data components.
- a user in some fashion selects a subset of the object-representing icons in one of the displays, and the display system indicates which of the icons in the other display correspond to the same data objects.
- the user may, for example, select objects by causing a cursor to touch the corresponding icons or draw an enclosure about them; in the histogram case the user may simply click on one of the bars. Or he may select the objects in some other manner, such as by entering a selection criterion.
- some conventional display systems highlight the other display's icons that correspond to the same objects. But conventional highlighting can obscure the information provided by, for instance, color. Using motion instead avoids this effect.
- FIG. 4 illustrates this type of brushing for a situation in which both displays are histograms of the type described above.
- the user has selected one of the income bins, and, by moving the corresponding icons in the lower plot, the display system illustrates the user-selected income group's distribution among the various age groups.
- the distinction is between two directions of linear motion. Both other types of motion can be used instead or in addition. Both these types of linear motion could be distinguished from diagonal linear motion, for example. Distinctions could also be made on the basis of phase or frequency: two sets of nodes vibrating linearly in the same direction could be caused to vibrate out of phase with each other, or at different frequencies.
- the motion need not be linear; it may be elliptical, for instance, in which case another distinction can be made on the basis of whether the motion is clockwise or counterclockwise. And the motion is not necessarily a change in position from some rest position; it can, for instance, be a change in shape, such as rhythmic expansion and contraction of the icon that represents the data object.
- FIGS. 5A , 5 B, and 5 C depict one component.
- the plot of FIG. 5A would be the component parallel to, say, ellipse's major axis, with which the motion component parallel to the minor axis would be 90.degree. out of phase.
- the harmonic motion that FIG. 5A depicts is typical. But some embodiments may instead or additionally employ other types of motion, such as the stuttering motion of FIG. 5B . Another example is the repeatedly decaying harmonic motion that FIG. 5C illustrates.
- Another aspect of the invention is directed to the way in which the motion is generated.
- the motion results from depicting moving three-dimensional bodies on the display.
- Each body represents a respective data object, and various features of the body's motion represent respective components of data object's multi-dimensional data.
- the particular type of body is not critical, but FIG. 6 depicts for the sake of example a simple body type that we have employed.
- body 602 includes nothing more than an upright 604 and an arm 606 attached to the upright.
- each pixel is usually represented by a color vector consisting of components for, say, red, green, and blue, cyan, magenta, and yellow, or some similar set of values by which a natural color can be approximated.
- the data are often the output of a camera whose sensors measure radiation intensities within different visible-light bands.
- Hyperspectral images are similar in the sense that each pixel is represented by a vector whose components represent radiation within different wavelength bands. The difference is that the number of wavelength bands is usually much more than three, and most bands do not fall within the visible range.
- the values usually represent intensities; they may additionally or instead represent other quantities, such as Stokes parameters.
- FIG. 7 is a conceptual block diagram of the overall approach.
- the raw data will typically be in the form of a two-dimensional array of high-dimensional pixel values. That is, the object's position in the array implicitly encodes the two-dimensional location of the pixel that the (high-dimensional) object represents, although there is no reason in principle why three-dimensional-location information could not be stored, in a three-dimensional array.
- the raw data's location granularity is coarser or finer than is convenient for employing simulated three-dimensional bodies to represent the objects, so the data may be re-sampled, as block 702 indicates, typically by employing one of the standard multi-rate sampling techniques.
- a body model is then constructed for each object, as block 704 indicates.
- FIG. 8 depicts two bodies 802 and 804 in a (three-dimensional) model space.
- the original image plane is mapped to a map plane 806 or other two-dimensional map surface in model space, and the bodies 802 and 804 are assigned zero-displacement positions at the locations in the model space to which the pixels that they represent are mapped.
- a body's zero-displacement position may be considered to be the one at which its upright is oriented perpendicular to the map plane and intersects the map plane at the upright's midpoint.
- Each of a plurality of a given data object's components are then mapped to various aspects of the moving body's features, including size, rate and/or mode of motion, and position.
- the value of one of the data components e.g., intensity, another Stokes parameter, or some other radiation-indicating quantity in the hyperspectral example—may be encoded in—the arm's elevation angle 810 .
- Another component say, another of the Stokes parameters for the same band—may be encoded in the arm's rate and direction of azimuthal rotation 812 .
- pitch, roll, and yaw axes may be defined with respect to the normal to the map plane, and various components may be encoded in the upright's roll, pitch, and yaw angles and in those angles' rate of change. And components can be encoded in the body's size. For example, some embodiments may encode certain components in the arms' and uprights' lengths or thicknesses or in ratios of those lengths or thicknesses or in the rates at which any of those change.
- the upright too, is made to move, other components can be encoded in various aspects of that motion. If the motion is simple up-and-down motion, for example, data components can be encoded in the upright's mean position (with respect to its zero-displacement position) and in the amplitude, phase, and frequency of its vertical motion. If the upright's motion is more complex, further components can be encoded in that motion's other aspects. Note also that some of these features do not require that the body move.
- the system attributes physical characteristics such as mass, elasticity, etc. to the bodies and that one or more components are encoded into such features.
- the bodies are simulated as being disposed in a gravitational field and/or as being attached to a common platform that undergoes some type of motion, such as rhythmic or irregular translation or pivoting.
- the system encodes the data indirectly in the motion: the types of motion that the bodies undergo depend on the underlying data, so, again, the display may reveal patterns in the data. Similar effects may be exhibited if the system simulates wind flowing past the bodies.
- the bodies may be desirable for the bodies to take the forms of flexible reeds in whose features the object components are so encoded as to affect the reed's flexibility.
- Other forms of indirect encoding will also suggest themselves to those skilled in the art.
- the shape parameters on which we have concentrated are the upright's height, the arm's length, the angle that the arm forms with the upright, the upright's angle with respect to the map plane, and the arm's azimuth, i.e., its position around the upright.
- the motion parameters came in four categories: azimuthal rotation of the upright, changes in the entire body's vertical position, circular changes in its horizontal position, and changes in the upright's tilt angle.
- the time variation of the motion in each case was a simple sinusoid, so there were three parameters, namely, amplitude, frequency, and phase, within each of the four categories.
- a further parameter within at least the first three categories is the mean, or “rest” position about which the motion occurs.
- a data component can be encoded in the difference between this and the zero-displacement position to which the corresponding pixel has been mapped.
- FIG. 7 's block 706 represents all such encoding. It is apparent that, at least theoretically, an extremely high number of different data components can thus be encoded in a body's features. As a practical matter, of course, there comes a point at which the resultant visual information becomes overwhelming to the human viewer. But we believe that a human viewer can effectively comprehend patterns resulting from up to fifteen and possibly more different components encoded in this fashion.
- FIG. 8 depicts a perspective projection, i.e., one in which points such as point 814 in the model space are projected onto the screen plane 816 along a line such as line 818 from the model-space point to a common viewpoint 820 located a finite distance away. More typically, the projection would be orthogonal: the viewpoint would be disposed at an infinite distance. In any event, the display would then be so driven as to produce the resultant image, as FIG. 7 's block 710 indicates.
- FIG. 9 depicts a small portion of a display that can result when the map plane forms a relatively small angle with the screen plane.
- the projections of some of the bodies are so small as to be nearly imperceptible, while other bodies' projections are quite long.
- data components are thus encoded, the user typically would not, in that example, directly infer the values of an individual data object's components from the display. He would instead observe overall patterns, possibly of the type that FIG. 10 illustrates, from which he may be able to infer information about the scene or identify avenues for further inquiry.
- a display system can enable a user to detect patterns readily in a presentation of highly complex data.
- the invention thus constitutes a significant advance in the art.
- Another type of display that benefits from the use of motion to distinguish different sets of data is the type that employs “layers” of data.
- a simple example is simultaneous presentation of different sets of transistor characteristic curves.
- a bipolar transistor's characteristics are often given as a set of curves on a common graph, each curve depicting collector current as a function of collector-to-emitter voltage for a different value of base current.
- To compare transistors it would be helpful to be able to compare their characteristic curves visually.
- One way to do this is to plot different transistors' curve sets on the same axes.
- This type of display may be referred to as a “layered” display because different transistors' curves can be thought of as being disposed on transparent sheets, or “layers” that lie on top of one another.
- a first motion is imparted on the entire layer of interest relative to the remaining layers. If a user is interested in more than one type of data, additional layers may be set in motion. Each layer is imparted with a distinctive motion relative to the remaining layers. For example, a first layer may be vibrated horizontally, a second layer may be vibrated vertically, and a circular motion may be imparted on a third layer.
- each transistor curve may be assigned to its own layer.
- a user may then select two transistors for particular attention from a group of, say, ten whose data a display presents.
- the display may make one selected transistor's curves vibrate vertically and the other's vibrate horizontally.
- the user could then readily recognize which data belong to the chosen transistors, and the comparison could be aided by having a given curve color represent the same base-current value for all transistors.
- Graphics software known in the art including DirectX provided by Microsoft Corporation of Redmond, Wash., and OpenGL, an open source graphics library originally made available by Silicon Graphics, Inc. of Sunnydale, Calif., provide functionality for the display of layered images, as well as imparting relative motion to layers within such layered images.
- each layer preferably includes data sharing a common characteristic.
- each layer may include data generated from a different imaging source.
- An image source may be an image capture device or a data storage medium independent of an image capture device.
- each image capture device may emit or detect electromagnetic radiation of different wavelengths or energies.
- one image source may generate images from light in the visible spectrum.
- a second image source may generate images from light in the infrared portions of the spectrum.
- a third image source may generate images from light in the ultraviolet portions of the spectrum.
- X-ray images generated from multiple emission energies may be stored as separate layers.
- Other suitable image capture devices include, without limitation, radar systems, ultrasound devices, geophones, gravitational field sensors, or any sensor that outputs data in relative to spatial position.
- FIGS. 11A-11C are illustrative outputs of a geographic information system (GIS), according to an illustrative embodiment of the invention.
- GIS systems are one class of system that would benefit substantially from the layered display technique described above.
- the layered-display technique is particularly useful for naturally graphical data such as map data.
- Maps may include depictions of roads; utilities infrastructure, including power lines, sewage pipes, water main, gas pipes, telecommunications infrastructure, etc.; zoning information; geo-registered satellite or aerial imagery, including imagery generated from light in or out of the visible spectrum; radar information; or other visual representation of data corresponding to a mapped location, including population density, demographic data, meteorological data, intelligence data, vegetation type, etc.
- each of these data types may be stored separately.
- Each data type may be stored in a single layer or in multiple layers.
- road data may be stored as a layer of municipal roads, a layer of state roads, and a layer of federal highways.
- Zoning data maybe stored so that each zoning classification is stored as a separate layer, or it may be stored as a single map layer.
- a map displayed by the GIS typically would include two or more layers overlaid one another.
- at least one of the layers is displayed with at least some degree of transparency such that an underlying layer is at least partially visible underneath.
- the color of at least some pixels in the displayed image at a given point in time are combinations or mixtures of the colors of associated with overlapping positions in the respective layers.
- the colors of pixels change to take into account different mixtures and combinations of pixel colors from changes in positions that overlap.
- a user of the GIS selects layers of interest using a user interface.
- a legend identifying each of the displayable layers is presented to a user.
- the user then can select the layers desired to be displayed by, for example, clicking a mouse on a check box to select a layer, and then selecting a desired motion from a drop down menu. Additional user interface controls may be made available to adjust the amplitude of the motion as well as the transparency of any of the layers.
- the user may select the layers to impart motion on by entering a query. Motion is then imparted on the layers that satisfy the query.
- FIG. 11A includes four individual layers 1102 a - 1102 d (generally layers “ 1102 ”) of geographical information, corresponding to overlapping geographical space, in this example, a portion of the Boston Metropolitan area.
- Layer 1102 a includes political boundaries 1104 .
- Layer 1102 b includes local connector roads 1106 .
- Layer 1102 c includes interstate highways 1108 .
- Layer 1102 d includes commuter rail tracks 1109 .
- the four layers can be displayed overlaid one another to form map 1110 .
- Each layer 1102 is at least partially transparent such that features in the underlying layers are visible.
- FIG. 11B includes three simulated screen shots 1120 a - 1120 c (generally screen shots “ 1120 ”) of a portion 1112 , outlined in phantom, of the map 1110 FIG. 11A .
- the screen shots 1120 a - 1120 c simulate the motion that may be imparted on one or more layers 1102 d of a map, according to an illustrative embodiment, to highlight information included in the respective layers.
- features from each of the layers 1102 a - 1102 d are visible, including political boundary 1104 , local connector roads 1106 , interstate highways 1108 , and rail tracks 1109 .
- Screen shot 1120 a illustrates the portion of the map 1110 before any motion is imparted on any layers 1102 .
- Screen shot 1120 b illustrates the portion of the map at a first instant of time after motion has been imparted on the political boundary and interstate highway layers 1102 a and 1102 c , respectively. The original position of the political boundary 1104 and highway 1108 are depicted in phantom for reference.
- Screen shot 1120 c illustrates the portion of the map 1110 at a second instant in time. As can be seen by comparing screen shot 1120 b to 1120 c , the political boundary layer 1102 a has been put into a vertical oscillatory motion and the interstate highway layer 1102 c has been put into a horizontal oscillatory motion.
- more dynamic oscillatory motions including any other regular or irregular oscillatory movement may be employed without departing from the scope of the invention.
- the relative movement of the political boundary layer 1102 a and the interstate highway layer 1102 c relative to the remaining layers 1102 b and 1102 d serve to highlight to a viewer the position of the political boundaries 1104 and the highway 1108 .
- FIG. 11C is discussed further below.
- FIGS. 12A and 12B depict simulated outputs of an X-Ray screening machine incorporating the data visualization technology described herein.
- the X-Ray machine includes dual- or multi-energy level X-Ray beams generated by one or more X-Ray sources.
- the images generated from each respective X-Ray beam are saved as separate layers.
- the layers are then overlaid one another for presentation to a security screener.
- the X-Ray data collected from each source is color coded with a respective color, corresponding to the atomic number of the material detected in the X-Ray image.
- the coloring is omitted in the simulated outputs to retain clarity.
- layers corresponding to such materials are automatically imparted with a predetermined motion relative to the remaining layers, such that such material can be readily observed in context with the location of the material in relation to other materials in an item being examined.
- a user of the X-Ray machine may manually select layers to impart motion to, as well as the desired motion. Additional controls may be used to adjust the amplitude of the motion and the transparency of the various layers.
- FIG. 12A includes two simulated X-ray output layers 1202 a and 1202 b , and an overlay 1204 of the output layers 1202 a and 1202 b .
- Layer 1202 a includes identified inorganic materials, i.e., a suitcase 1206 and a teddy bear 1208 included therein.
- Layer 1202 b includes metal objects identified by an X-ray scan at a second energy level.
- the layer 1202 b includes a knife 1210 , as well as various metal components 1212 of the suitcase 1206 .
- the overlay 1204 illustrates how the packer of the suitcase 1206 may have attempted to obscure the knife 1210 by placing it behind the teddy bear 1208 . By imparting motion on the metal layer, a viewer of the overlay 1204 of the layers 1202 a and 1202 b is able to quickly identify the knife 1210 .
- FIG. 12B includes three screenshots 1220 a - 1220 c of a portion of the simulated X-ray output of FIG. 12A (depicted in Figure A as the rectangular region enclosed by dashed lines).
- the first screen shot 1220 a depicts the layers 1202 a and 1202 b in their original position.
- Screen shots 1220 b and 1220 c depict the overlay at two points in time.
- the phantom lines illustrate the original position of the knife 1210 , as in screen shot 1220 a .
- the depicted movement of layer 1202 b is simplified to a simple horizontal oscillation. Imparted movement may include a simple oscillation as depicted, or a more dynamic complex oscillation.
- FIGS. 13A-13B depict the output of a data visualization system integrated with a viewfinder, for example, of a vehicle, such as a tank or an aircraft, according to an illustrative embodiment of the invention.
- a viewfinder typically display data generated from visible light cameras as well as infrared sensors and/or radar systems.
- the viewfinder display may also include mission data and/or instrumentation data, including vehicle speed, location, target range, etc.
- the data visualization system integrated with the view finder stores visible light data, infrared data, mission data and instrumentation data as separate layers, which and then displayed overlaid one another. To draw attention to data in a particular layer, the data visualization system imparts motion to the particular layer relative to the remaining layers.
- FIG. 13A depicts three separate layers 1302 a - 1302 c of simulated graphical data that may be overlaid one another to form the output of a viewfinder.
- Layer 1302 a includes an image taken from a visible light imaging device. Visible in layer 1302 a are two buildings 1304 and a fence 1306 .
- Layer 1302 b includes an image taken from an infrared imaging source. In layer 1302 b , people 1308 are visible crouched behind the fence 1306 and below a window in the second floor of one of the buildings 1304 .
- Layer 1302 includes computer generated mission data, including speed, current coordinates, target coordinates, and a weapon status indicator.
- Overlay 1310 depicts the results of graphically overlaying the three layers 1302 a - 1302 , with each layer being at least partially transparent such that features of underlying layers are visible.
- FIG. 13B illustrates how one of the layers can be oscillated relative to the other layers to highlight information included in the oscillating layer.
- FIG. 13B includes three screenshots 1320 a - 1320 c of an overlay of the three layers 1302 a - 1302 c .
- the first screen shot 1320 a of FIG. 13B depicts the original alignment of the layers 1302 a - 1302 c .
- the remaining screen shots 1320 b and 1320 c depict the overlay at various times while the layer including infrared data is put into oscillation.
- the data displayed in layers by the data visualization system is not received as distinct layers. Instead, the data is divided into layers having common characteristics after receipt.
- a machine learning program may identify features in an image and store such features in a layer distinct from the remainder of the image.
- the data visualization system detects objects of interest in an image using object-class detection algorithms known in the art.
- the data visualization system may detect, for example, faces and/or text characters and store each in a respective layer.
- the data visualization system displays the layers overlaid one another. To draw attention to all faces in the image, the data visualization system imparts motion to the layer in the image corresponding to faces.
- To highlight text the data visualization system imparts motion to the layer in the image corresponding to text characters.
- Similar data analysis can be applied to other forms of image data, including sonar, radar, or infrared images, in which objects of interest, e.g., submarines, aircraft, or roads, respectively, can be detected based on known signatures. Regions of the images having such signatures are stored in respective layers for overlaid display. Similar processing may be carried out on medical images, including x-rays, catscans, MRIs, etc. For example, portions of images corresponding to particular tissue densities or ranges of tissues densities may be stored in a separate layers. The data visualization system then, automatically in response to software instructions executing on the data visualization system, or manually in response to user input, imparts motion on one or more of the layers to highlight the data stored therein. In the medical image context, selective motion of portions of a medical image based on tissue density may reveal features otherwise difficult to identify, including tumors, nerves, or vasculature.
- the data visualization system visually conveys additional data by imparting a local motion on a portion of a layer relative to the remainder of the layer.
- Suitable local motions include harmonic vibrations of regions of the layer similar to those describe above, as well as distortions to regions of the layer. The distortions may result, for example, in the region of the layer appearing to ripple, as if a viewer were viewing the layer through water.
- the data visualization system may impart motion upon a map layer corresponding to highways relative to a terrain image layer and an electrical grid layer, thus visually highlighting the location of roads on the map relative to the surrounding terrain and electrical infrastructure.
- the data visualization system imparts a local motion on portions of the layer surround the congested roads such that the roads in that region move or distort relative to the remainder of the road map layer.
- the data visualization system may impart a different local motion on regions to portions of the electrical grid map layer corresponding to regions having increased power consumption.
- FIG. 11C illustrates one such distortion effect.
- FIG. 11C includes two screen shots 1130 a and 1130 b of the portion of the map 1110 .
- Screen shot 1130 a depicts the portion without distortion.
- screen shot 1130 b local roads in the portion are distorted to depict high traffic volumes.
- each layer of visual data to be displayed is first projected onto a transparent array of geometric shapes, for example triangles.
- the data visualization system displays the projections overlaid one another.
- the data visualization system imparts a rhythmic shifting to the vertices of the geometric shapes in a particular area, stretching or shrinking the content filling the geometric shapes. Additional rippling techniques, as well as different and/or additional visual effects may be used to impart local motion on a portion of a layer without departing from the scope of the invention.
- one or more additional layers of visual effects are added to a set of overlaid data layers displayed to a user.
- the visual effect layers include opaque or partially transparent localized visual effects that include some form of dynamic movement. Suitable visual effects include fog, mist, rippling water, smoke, etc.
- the primary difference between the visual effects in the visual effects layer from the localized movement or distortion imparted on portions of data layers is that the visual effects in the visual effects layer preferably are colored such that the color of portions of underlying layers change as a result of the dynamic movement of the visual effects.
- any color changes in the displayed image result from changing combinations of the colors associated with overlapping positions in the data layers as points in each layer overlap in different ways as the portions of the data layer move or distort.
Abstract
Description
Claims (34)
Priority Applications (3)
| Application Number | Priority Date | Filing Date | Title |
|---|---|---|---|
| US11/961,242 US7629986B2 (en) | 2003-11-05 | 2007-12-20 | Motion-based visualization |
| PCT/US2008/013884 WO2009108179A2 (en) | 2007-12-20 | 2008-12-19 | Motion-based visualization |
| US12/618,389 US20100118049A1 (en) | 2003-11-05 | 2009-11-13 | Motion-based visualization |
Applications Claiming Priority (3)
| Application Number | Priority Date | Filing Date | Title |
|---|---|---|---|
| US10/703,102 US7069520B2 (en) | 2003-11-05 | 2003-11-05 | Motion-based visualization |
| US11/431,338 US7315306B2 (en) | 2003-11-05 | 2006-05-09 | Motion-based visualization |
| US11/961,242 US7629986B2 (en) | 2003-11-05 | 2007-12-20 | Motion-based visualization |
Related Parent Applications (1)
| Application Number | Title | Priority Date | Filing Date |
|---|---|---|---|
| US11/431,338 Continuation-In-Part US7315306B2 (en) | 2003-11-05 | 2006-05-09 | Motion-based visualization |
Related Child Applications (1)
| Application Number | Title | Priority Date | Filing Date |
|---|---|---|---|
| US12/618,389 Continuation-In-Part US20100118049A1 (en) | 2003-11-05 | 2009-11-13 | Motion-based visualization |
Publications (2)
| Publication Number | Publication Date |
|---|---|
| US20080158257A1 US20080158257A1 (en) | 2008-07-03 |
| US7629986B2 true US7629986B2 (en) | 2009-12-08 |
Family
ID=39583250
Family Applications (1)
| Application Number | Title | Priority Date | Filing Date |
|---|---|---|---|
| US11/961,242 Expired - Lifetime US7629986B2 (en) | 2003-11-05 | 2007-12-20 | Motion-based visualization |
Country Status (1)
| Country | Link |
|---|---|
| US (1) | US7629986B2 (en) |
Cited By (4)
| Publication number | Priority date | Publication date | Assignee | Title |
|---|---|---|---|---|
| US20090193037A1 (en) * | 2008-01-25 | 2009-07-30 | Intuit Inc. | Method and apparatus for displaying data models and data-model instances |
| US20100036548A1 (en) * | 2008-08-08 | 2010-02-11 | Honeywell International Inc. | Method and system for operating a display device on-board an aircraft |
| US20100302255A1 (en) * | 2009-05-26 | 2010-12-02 | Dynamic Representation Systems, LLC-Part VII | Method and system for generating a contextual segmentation challenge for an automated agent |
| US20210279385A1 (en) * | 2020-02-28 | 2021-09-09 | Weta Digital Limited | Method for Generating Simulations of Fluid Interfaces for Improved Animation of Fluid Interactions |
Families Citing this family (5)
| Publication number | Priority date | Publication date | Assignee | Title |
|---|---|---|---|---|
| US8941680B2 (en) * | 2008-07-09 | 2015-01-27 | Raytheon Bbn Technologies Corp. | Volumetric image motion-based visualization |
| US8893034B2 (en) * | 2010-01-27 | 2014-11-18 | Yahoo! Inc. | Motion enabled multi-frame challenge-response test |
| EP2544152A3 (en) * | 2011-07-07 | 2013-02-20 | HTC Corporation | Management of multiple interface display layers |
| AR101678A1 (en) * | 2014-09-11 | 2017-01-04 | Sony Corp | INFORMATION PROCESSING DEVICE, INFORMATION PROCESSING METHOD AND LEGIBLE STORAGE ENVIRONMENT BY NON-TRANSITORY COMPUTER PROGRAM STORAGE |
| US9996955B2 (en) | 2014-09-23 | 2018-06-12 | Salesforce.Com, Inc | Analytics visualization |
Citations (16)
| Publication number | Priority date | Publication date | Assignee | Title |
|---|---|---|---|---|
| US4613946A (en) | 1984-06-07 | 1986-09-23 | Forman Ernest H | Method and apparatus for generating hierarchical displays |
| US5267154A (en) | 1990-11-28 | 1993-11-30 | Hitachi, Ltd. | Biological image formation aiding system and biological image forming method |
| US6337699B1 (en) | 1996-06-27 | 2002-01-08 | Sun Microsystems, Inc. | Visualizing degrees of information object attributes |
| US6462762B1 (en) | 1999-08-05 | 2002-10-08 | International Business Machines Corporation | Apparatus, method, and program product for facilitating navigation among tree nodes in a tree structure |
| US6509906B1 (en) | 1999-04-29 | 2003-01-21 | Autodesk, Inc. | Display representations and streams for objects having authorable and dynamic behaviors and appearances |
| US6587787B1 (en) * | 2000-03-15 | 2003-07-01 | Alpine Electronics, Inc. | Vehicle navigation system apparatus and method providing enhanced information regarding geographic entities |
| US20030206205A1 (en) | 2002-05-01 | 2003-11-06 | Hideya Kawahara | Using a simple input device to browse through content on a graphical display |
| US20040095378A1 (en) | 2000-06-09 | 2004-05-20 | Michael Vigue | Work/training using an electronic infrastructure |
| WO2004095378A1 (en) | 2003-04-24 | 2004-11-04 | Koninklijke Philips Electronics N.V. | Combined 3d and 2d views |
| US6856329B1 (en) | 1999-11-12 | 2005-02-15 | Creative Technology Ltd. | Automated acquisition of video textures acquired from a digital camera for mapping to audio-driven deformable objects |
| US20050093867A1 (en) | 2003-11-05 | 2005-05-05 | Bobrow Robert J. | Motion-based visualization |
| US20050114551A1 (en) | 2003-08-29 | 2005-05-26 | Prithwish Basu | Systems and methods for automatically placing nodes in an ad hoc network |
| US20050147283A1 (en) | 2003-11-10 | 2005-07-07 | Jeff Dwyer | Anatomical visualization and measurement system |
| US6961061B1 (en) * | 2002-04-19 | 2005-11-01 | Weather Central, Inc. | Forecast weather video presentation system and method |
| US7116749B2 (en) | 2003-06-25 | 2006-10-03 | Besson Guy M | Methods for acquiring multi spectral data of an object |
| US20070257912A1 (en) | 2006-05-08 | 2007-11-08 | Dmitriy Repin | Method for locating underground deposits of hydrocarbon including a method for highlighting an object in a three dimensional scene |
-
2007
- 2007-12-20 US US11/961,242 patent/US7629986B2/en not_active Expired - Lifetime
Patent Citations (19)
| Publication number | Priority date | Publication date | Assignee | Title |
|---|---|---|---|---|
| US4613946A (en) | 1984-06-07 | 1986-09-23 | Forman Ernest H | Method and apparatus for generating hierarchical displays |
| US5267154A (en) | 1990-11-28 | 1993-11-30 | Hitachi, Ltd. | Biological image formation aiding system and biological image forming method |
| US6337699B1 (en) | 1996-06-27 | 2002-01-08 | Sun Microsystems, Inc. | Visualizing degrees of information object attributes |
| US6509906B1 (en) | 1999-04-29 | 2003-01-21 | Autodesk, Inc. | Display representations and streams for objects having authorable and dynamic behaviors and appearances |
| US6462762B1 (en) | 1999-08-05 | 2002-10-08 | International Business Machines Corporation | Apparatus, method, and program product for facilitating navigation among tree nodes in a tree structure |
| US6856329B1 (en) | 1999-11-12 | 2005-02-15 | Creative Technology Ltd. | Automated acquisition of video textures acquired from a digital camera for mapping to audio-driven deformable objects |
| US6587787B1 (en) * | 2000-03-15 | 2003-07-01 | Alpine Electronics, Inc. | Vehicle navigation system apparatus and method providing enhanced information regarding geographic entities |
| US20040095378A1 (en) | 2000-06-09 | 2004-05-20 | Michael Vigue | Work/training using an electronic infrastructure |
| US6961061B1 (en) * | 2002-04-19 | 2005-11-01 | Weather Central, Inc. | Forecast weather video presentation system and method |
| US20030206205A1 (en) | 2002-05-01 | 2003-11-06 | Hideya Kawahara | Using a simple input device to browse through content on a graphical display |
| WO2004095378A1 (en) | 2003-04-24 | 2004-11-04 | Koninklijke Philips Electronics N.V. | Combined 3d and 2d views |
| US7116749B2 (en) | 2003-06-25 | 2006-10-03 | Besson Guy M | Methods for acquiring multi spectral data of an object |
| US20050114551A1 (en) | 2003-08-29 | 2005-05-26 | Prithwish Basu | Systems and methods for automatically placing nodes in an ad hoc network |
| US20050093867A1 (en) | 2003-11-05 | 2005-05-05 | Bobrow Robert J. | Motion-based visualization |
| US7069520B2 (en) | 2003-11-05 | 2006-06-27 | Bbn Technologies Corp. | Motion-based visualization |
| US7280122B2 (en) | 2003-11-05 | 2007-10-09 | Bbn Technologies Corp. | Motion-based visualization |
| US7315306B2 (en) | 2003-11-05 | 2008-01-01 | Bbn Technologies Corp. | Motion-based visualization |
| US20050147283A1 (en) | 2003-11-10 | 2005-07-07 | Jeff Dwyer | Anatomical visualization and measurement system |
| US20070257912A1 (en) | 2006-05-08 | 2007-11-08 | Dmitriy Repin | Method for locating underground deposits of hydrocarbon including a method for highlighting an object in a three dimensional scene |
Non-Patent Citations (25)
| Title |
|---|
| Ahlberg et al., "Dynamic Queries for Information Exploration: An Implementation and Evaluation" In Proceedings of CHI'92. ACM, pp. 619-626. |
| Bartram et al., "Filtering and Brushing with Motion," Information Visualization, 1(1):66-79. |
| Bartram et al., "Moving Icons: Detection and Distraction," In Proceedings of Interact 2001. |
| Becker et al., "Brushing Scatterplots," Technometrics, 29(2):127-142, (1987). |
| Braddick et al., "Serial Search for Targets Defined by Divergence or Deformation of Optic Flow," Perception, 20:345-354, (1991). |
| Callaghan, T.C., "Interference and Dominance in Texture Segregation," In Visual Search, D. Brogan, Ed. Taylor & Francis, pp. 81-87. |
| Driver et al., "Motion Cohrence and Conjunction Search: Implications for Guided Search Theory," Perception & Psychophysics, 51(1):79-85, (1992). |
| Duncan, et al., "Visual Search and Stimulus Similarity," Psychological Review, 96:433-458, (1989). |
| Duncan, J., "Boundary Conditions on Parallel Processing in Human Vision," Perceptions, 18:457-469, (1989). |
| Gronquist et al., "Animated Vectors for Visualization of Power System Phenomena," IEEE Transactions on Power Systems, 11(1):267-273, (1996). |
| Healey, Christopher, "Perceptual Techniques for Scientific Visualization," ACM SIGGRAPH, Course 6, pp. 1-26. |
| Healey, Christopher, "Visualizing Real-Time Multivariate Data Using Preattentive Processing," ACM Transactions on Modeling and Computer Simulation, 5(3):190-221. |
| Hunn, Ketil, "Preattentive Visual Information Processing," http://home.eunet.no/khunn/papers/2030.html., Research Proposal, (2000). |
| International Search Report and Written Opinion dated Sep. 1, 2009 in International Application No. PCT/US2008/013884. |
| Kruecker et al, "Fusion of real-time trans-rectal ultrasound with pre-acquired MRI for multi-modality prostate imaging", Proc. of SPIE - The International Society for Optical Engineering, vol. 6509, Mar. 21, 2007, pp. 650912/1 - 650912/12. |
| Lum et al, "Using motion to illustrate static 3D shape - Kinetic visualization," IEE Transactions on Visualization and Computer graphics, vol. 9, No. 2, Apr.-Jun. 2003, pp. 115-126. |
| McLeod, et al., "Visual Search for a Conjunction of Movement and Form is Parallel," Nature, 332(10):154-155, (1988). |
| Nakayama et al., "Serial and Parallel Processing of Visual Feature Conjunctions," Nature 320(20):264-265, (1986). |
| Quinlan, et al., "Visual Search for Targets Defined by Combination of Color, Shape and Size: An Examination of Task Constraints on Feature and Conjunction Searches," Perception & Psychophysics, 41(5):455-472, (1987). |
| Ramos et al, "Tumble Splat Helping users access and manipulate occluded content in 2d drawings," Proceedings of the Working Conference on Advanced Visual Interfaces, 2006, pp. 428-435. |
| Robinson, Anthony C., "Highlighting techniques to support geovisualization," ICA Workshop on Geovisualization and Visual analystics, 2006, pp. 1-18. |
| Treisman, "Preattentive Processing in Vision," Computer Vision, Graphics and Image Processing, 31:156-177, (1985). |
| Treisman, "Search, Similarity, and Integration of Features between and within dimensions," Journal of Experimental Psychology: Human Perception and Performance, 17(3):652-676, (1991). |
| Ware et al., "Perceiving Data Displayed Through Oscillatory Motion," Tech. Rep. TR94-089, Faculty of Computer Science, University of New Brunswick, (1994). |
| Wickens, et al., "The Proximity Compatibility Principle: Its Psychological Foundation and Relevance to Display Design," Human Factors, 37(3):473-494, (1995). |
Cited By (9)
| Publication number | Priority date | Publication date | Assignee | Title |
|---|---|---|---|---|
| US20090193037A1 (en) * | 2008-01-25 | 2009-07-30 | Intuit Inc. | Method and apparatus for displaying data models and data-model instances |
| US7904478B2 (en) * | 2008-01-25 | 2011-03-08 | Intuit Inc. | Method and apparatus for displaying data models and data-model instances |
| US8156155B1 (en) | 2008-01-25 | 2012-04-10 | Intuit Inc. | Method and apparatus for displaying data models and data-model instances |
| US20100036548A1 (en) * | 2008-08-08 | 2010-02-11 | Honeywell International Inc. | Method and system for operating a display device on-board an aircraft |
| US8170729B2 (en) * | 2008-08-08 | 2012-05-01 | Honeywell International Inc. | Method and system for operating a display device on-board an aircraft |
| US20100302255A1 (en) * | 2009-05-26 | 2010-12-02 | Dynamic Representation Systems, LLC-Part VII | Method and system for generating a contextual segmentation challenge for an automated agent |
| US20210279385A1 (en) * | 2020-02-28 | 2021-09-09 | Weta Digital Limited | Method for Generating Simulations of Fluid Interfaces for Improved Animation of Fluid Interactions |
| US11341301B2 (en) * | 2020-02-28 | 2022-05-24 | Unity Technologies, SF | Method for generating simulations of fluid interfaces for improved animation of fluid interactions |
| US11455444B2 (en) * | 2020-02-28 | 2022-09-27 | Unity Technologies Sf | Method for generating simulations of fluid interfaces for improved animation of fluid interactions |
Also Published As
| Publication number | Publication date |
|---|---|
| US20080158257A1 (en) | 2008-07-03 |
Similar Documents
| Publication | Publication Date | Title |
|---|---|---|
| US7629986B2 (en) | Motion-based visualization | |
| US7280122B2 (en) | Motion-based visualization | |
| Carr et al. | Hexagon mosaic maps for display of univariate and bivariate geographical data | |
| Dykes et al. | Seeking structure in records of spatio-temporal behaviour: visualization issues, efforts and applications | |
| Pang | Visualizing uncertainty in geo-spatial data | |
| Glander et al. | Abstract representations for interactive visualization of virtual 3D city models | |
| Gajer et al. | Grip: Graph drawing with intelligent placement | |
| US20100118049A1 (en) | Motion-based visualization | |
| JPH08305525A (en) | Apparatus and method for display of information | |
| Weigle et al. | Oriented texture slivers: A technique for local value estimation of multiple scalar fields | |
| Vehlow et al. | Visualizing dynamic hierarchies in graph sequences | |
| Nocke et al. | visual analytics of climate networks | |
| US8250480B2 (en) | Interactive navigation of a dataflow process image | |
| Glander et al. | Cell-based generalization of 3D building groups with outlier management | |
| WO2009108179A2 (en) | Motion-based visualization | |
| Zhang et al. | A web-mapping system for real-time visualization of the global terrain | |
| US20060279436A1 (en) | Digital elevation model data structure for geospatial analysis | |
| Brown et al. | GRASS as an integrated GIS and visualization system for spatio-temporal modeling | |
| Ghanbari | Visualization Overview | |
| Fritsch et al. | Object Oriented Management of Raster Data in Geographic Information Systems | |
| Bastin et al. | Visualization of fuzzy spatial information in spatial decision-making | |
| Karkut et al. | Vegetation Coverage and Urban Amenity Mapping Using Computer Vision and Machine Learning [Vegetation Coverage and Urban Amenity Mapping Using Computer Vision and Machine Learning] | |
| Karkut et al. | Vegetation Coverage and Urban Amenity Mapping Using Computer Vision and Machine Learning. | |
| Andrienko et al. | Dynamic aggregation on grids for interactive analysis of multidimensional spatial information | |
| Sawant et al. | Need for perceptual display hierarchies in visualization |
Legal Events
| Date | Code | Title | Description |
|---|---|---|---|
| AS | Assignment |
Owner name: BBN TECHNOLOGIES CORP., MASSACHUSETTS Free format text: ASSIGNMENT OF ASSIGNORS INTEREST;ASSIGNORS:BOBROW, ROBERT J.;HELSINGER, AARON MARK;WALCZAK, MICHAEL J.;REEL/FRAME:020643/0146;SIGNING DATES FROM 20080123 TO 20080128 |
|
| AS | Assignment |
Owner name: BANK OF AMERICA N.A., AS AGENT, MASSACHUSETTS Free format text: INTELLECTUAL PROPERTY SECURITY AGREEMENT SUPPLEMENT;ASSIGNOR:BBN TECHNOLOGIES CORP.;REEL/FRAME:020768/0270 Effective date: 20080211 |
|
| STCF | Information on status: patent grant |
Free format text: PATENTED CASE |
|
| AS | Assignment |
Owner name: RAYTHEON BBN TECHNOLOGIES CORP.,MASSACHUSETTS Free format text: CHANGE OF NAME;ASSIGNOR:BBN TECHNOLOGIES CORP.;REEL/FRAME:024456/0537 Effective date: 20091027 Owner name: RAYTHEON BBN TECHNOLOGIES CORP., MASSACHUSETTS Free format text: CHANGE OF NAME;ASSIGNOR:BBN TECHNOLOGIES CORP.;REEL/FRAME:024456/0537 Effective date: 20091027 |
|
| FPAY | Fee payment |
Year of fee payment: 4 |
|
| AS | Assignment |
Owner name: BBN TECHNOLOGIES CORP. (AS SUCESSOR BY MERGER TO B Free format text: RELEASE BY SECURED PARTY;ASSIGNOR:BANK OF AMERICA, N.A. (SUCCESSOR BY MERGER TO FLEET NATIONAL BANK);REEL/FRAME:030524/0822 Effective date: 20091026 |
|
| FPAY | Fee payment |
Year of fee payment: 8 |
|
| MAFP | Maintenance fee payment |
Free format text: PAYMENT OF MAINTENANCE FEE, 12TH YEAR, LARGE ENTITY (ORIGINAL EVENT CODE: M1553); ENTITY STATUS OF PATENT OWNER: LARGE ENTITY Year of fee payment: 12 |