US7483842B1 - System and method for determining recommended action based on measuring and analyzing store and employee data - Google Patents
System and method for determining recommended action based on measuring and analyzing store and employee data Download PDFInfo
- Publication number
- US7483842B1 US7483842B1 US10/081,020 US8102002A US7483842B1 US 7483842 B1 US7483842 B1 US 7483842B1 US 8102002 A US8102002 A US 8102002A US 7483842 B1 US7483842 B1 US 7483842B1
- Authority
- US
- United States
- Prior art keywords
- performance
- data
- store
- sales
- employee
- Prior art date
- Legal status (The legal status is an assumption and is not a legal conclusion. Google has not performed a legal analysis and makes no representation as to the accuracy of the status listed.)
- Active, expires
Links
Images


Classifications
-
- G—PHYSICS
- G06—COMPUTING; CALCULATING OR COUNTING
- G06Q—INFORMATION AND COMMUNICATION TECHNOLOGY [ICT] SPECIALLY ADAPTED FOR ADMINISTRATIVE, COMMERCIAL, FINANCIAL, MANAGERIAL OR SUPERVISORY PURPOSES; SYSTEMS OR METHODS SPECIALLY ADAPTED FOR ADMINISTRATIVE, COMMERCIAL, FINANCIAL, MANAGERIAL OR SUPERVISORY PURPOSES, NOT OTHERWISE PROVIDED FOR
- G06Q30/00—Commerce
- G06Q30/02—Marketing; Price estimation or determination; Fundraising
-
- G—PHYSICS
- G06—COMPUTING; CALCULATING OR COUNTING
- G06Q—INFORMATION AND COMMUNICATION TECHNOLOGY [ICT] SPECIALLY ADAPTED FOR ADMINISTRATIVE, COMMERCIAL, FINANCIAL, MANAGERIAL OR SUPERVISORY PURPOSES; SYSTEMS OR METHODS SPECIALLY ADAPTED FOR ADMINISTRATIVE, COMMERCIAL, FINANCIAL, MANAGERIAL OR SUPERVISORY PURPOSES, NOT OTHERWISE PROVIDED FOR
- G06Q10/00—Administration; Management
- G06Q10/06—Resources, workflows, human or project management; Enterprise or organisation planning; Enterprise or organisation modelling
- G06Q10/063—Operations research, analysis or management
- G06Q10/0631—Resource planning, allocation, distributing or scheduling for enterprises or organisations
- G06Q10/06311—Scheduling, planning or task assignment for a person or group
- G06Q10/063112—Skill-based matching of a person or a group to a task
Definitions
- assessments are typically performed to monitor the progress and growth of the business and to identify areas of strength and flag potential weaknesses.
- assessments typically take the form of sales data outlining generated revenue, such as the gross receipts or the net profit of a particular store.
- a business environment includes a number of employees, each contributing their skills and knowledge to further the business. Maximum productivity and efficiency occurs when each employee is functioning to utilize their skills and knowledge to their fullest potential. An employee undertaking a role that does not invoke all their skills and knowledge may be underutilized, while an employee having insufficient skill or knowledge for a particular role will likely not be productive or efficient.
- Periodic assessment of the contribution of each employee is typically performed to identify achievement for items such as bonuses and merit increases. Such an assessment is reported to a central home office or accounting office.
- employee specific feedback concerning skills and knowledge is typically not communicated back to the employee for future development. Achievement may be recognized in the form of a bonus or large merit increase, while shortfalls may be met with a lower than average merit increase.
- Employee specific feedback regarding skill and knowledge development, and tracking employee development over time is not provided. Further, some organizations may not even communicate employee specific sales data to the home office, but rather employ only global figures for a particular site or store, leaving the individual employee merit determinations up to the local manager.
- a typical periodic assessment does not provide individual direction through formal training and proactive skill development. It would be beneficial to provide a system in which employee specific feedback and direction is provided in an iterative manner to develop individual skills and knowledge to increase productivity and efficiency, which in turn increases sales and revenue and allows the business to grow.
- a system and method for measuring and analyzing performance data including collecting transaction data indicative of performance factors, and analyzing the transaction data to compute an aggregate synopsis of performance of a subject under observation, or employee, provides quantitative data for providing feedback to the subject under observation for improving performance.
- a hypothesis is formed from the aggregate synopsis to determine one or more recommended actions directed to improving performance. The determined recommended actions are applied to the subject under observation, and a change in the performance as a result of applying the recommended actions is measured. Measuring and analyzing is repeated in an iterative manner to continually assess and develop employee skills toward increased performance and hence, increased sales.
- the transaction data collected includes field performance data to determine sales per hour, revenue per sale transaction and total customer flow, training data such as applied curriculum and skill development provided by the system, and external legacy data such as corporate administrative, retail store and human resource data.
- the aggregate synopsis provides quantitative performance scores within an expected performance range, and is employed to develop a hypothesis for improvement.
- the aggregate synopsis may be provided via predetermined reports aimed at identifying specific performance areas, or may be provided through ad-hoc reports generated via a query engine.
- the hypothesis is developed by a rule based expert systems, by manual inspection of the aggregate synopsis, or by other means, and is used to map the performance score to one or more recommended actions.
- the recommended actions are directed toward multimedia educational curriculum and identified skills to be developed.
- a feedback mechanism such as collection and analysis of subsequent transactional data, is employed to assess the effectiveness of the determined recommended actions.
- the transactional data is collected in a data store including a relational database of raw transaction data and a knowledge base including an aggregated transformation of the transaction data in a multidimensional database.
- the multidimensional database renders the data in an on-line analytical processing (OLAP) form adapted for hierarchical (drill-up/drill-down) access at a variety of granularity levels, as is known to those skilled in the art.
- OLAP on-line analytical processing
- the aggregated synopsis outputs a performance score indicative of a ranking within a performance range of expected scores in the experience category of the sales employee, such as low, medium, and high.
- a mapping is performed including the ranking and the experience category, and may include other factors such as store attributes and customer throughput.
- the mapping includes associating skills, knowledge, and sales data to recommended actions for improving performance.
- a hypothesis is developed concerning identified areas for improvement, and mapped to a predetermined set of recommended actions for developing the identified areas.
- the recommended actions include skills for practice on the sales floor and review or training via a learning center.
- the learning center provides a library of multimedia curriculum including magnetic, optical, and printed mediums of instruction and feedback, and is specifically designed to target the identified skills and knowledge for improvement.
- performance data concerning a sales employee is gathered and analyzed, and areas for improvement identified.
- the identified areas are addressed by recommended actions via a manager or coach, and developed through the learning center. Iterative application of skill and knowledge development allows feedback to be introduced to target and revisit specific areas for each sales employee. Improvement is measured by examining the transaction data at each cyclic application, thereby identifying increased performance and revenue in response to the applied recommended actions.
- FIG. 1 is a context diagram of the performance improvement measurement system (PIMS) as defined herein;
- PIMS performance improvement measurement system
- FIG. 2 is a block diagram of PIMS inputs and outputs
- FIG. 3 is a diagram of the iterative data and information flow in the system of FIG. 2 ;
- FIG. 4 is a block diagram of the system of FIG. 2 showing data population and analysis in greater detail;
- FIG. 5 is a block diagram of report output retrieval
- FIG. 6 is a data flow diagram of the development cycle iteration
- FIG. 7 a is a flowchart of the operation of the system of FIG. 4 ;
- FIG. 7 b is a flowchart of data gathering
- FIG. 7 c is a flowchart of the analysis of results
- FIG. 7 d is a flowchart of development analysis for determination of recommended actions
- FIGS. 8 a - 8 j show reports generated by the system of FIG. 4 ;
- FIGS. 9 a - 9 d are performance matrices for mapping of performance scores to recommended actions.
- FIG. 10 is a matrix showing scaling of performance standards.
- FIG. 1 shows a context diagram of the Performance Improvement Measurement System (PIMS).
- PIMS 12 is shown in the business environment 10 context.
- the environment 10 includes employee associates or sales employees 14 , a learning center 16 for implementing the skill and knowledge development, described further below, corporate management 18 , a plurality of field locations 20 , typically retail stores, each with a point of sale (POS) data system for gathering field data, and home office computing systems 22 , providing information such as revenue goals, accounting, and human resource data.
- POS point of sale
- FIG. 2 shows a block diagram of inputs and outputs of the system 12 .
- the system 12 receives data from a plurality of sources, including external and legacy data 24 from the home office such as corporate administrative and human resource data, field performance data 26 including POS data, and training data 28 such as educational curricula provided by a learning center and associated learning progress, described further below.
- the raw data 30 received by the system is employed to produce reports 32 containing a quantitative analysis of the raw data, also described further below.
- the reports 32 provide an aggregated synopsis of the raw data, shown by arrow 34 , organized at different levels of granularity, which are used to generate a hypothesis for improvement 36 for a subject under observation, such as an sales employee 14 ( FIG. 1 ).
- the hypothesis for improvement 36 determines particular skills or knowledge which the sales employee should improve on, based on the reports 32 , and indicates specific recommended actions to be undertaken, shown by arrow 38 .
- the recommended actions 38 selected are focused on the particular knowledge and/or skills which the individual employee should further develop, and include simple coaching from management, skills to practice at the retail location, or specific coursework curriculum to be initiated or reviewed.
- the recommended actions 38 are undertaken by the particular sales employee 14 .
- a subsequent evaluation will gather data from each of the sources 24 , 26 and 28 to produce periodically updated sets of raw data 30 for reevaluation after application of the recommended actions 38 .
- FIG. 3 is a diagram of the iterative data and information flow in the system of FIG. 2 .
- a data capture phase 40 includes gathering the raw data 30 from the data sources 24 , 26 , and 28 .
- the reports 32 generated from the raw data comprise development information 42 about each subject under observation.
- Development planning 44 includes developing a hypothesis for improvement 36 , and may include other aspects such as staffing and business goals.
- the development planning 44 is implemented via coaching activity 46 , which includes applying the determined recommended actions 38 to the employee 14 n .
- the coaching activity 46 results in developmental learning 48 , including skills, knowledge, and practice.
- the developmental learning is applied by floor activity 50 , in which the sales employee 14 applies and demonstrates the result of the developmental learning 48 .
- the information and data flow therefore follows a full feedback cycle through PIMS which continually monitors performance and determines steps for improvement.
- FIG. 4 is a block diagram of a particular embodiment of the system of FIG. 2 showing data population and analysis in greater detail.
- the transaction data is gathered from several sources.
- External and legacy data 24 , FIG. 2
- Field performance data 26 , FIG. 2
- training data 28 , FIG. 2
- learning center 60 data described further below.
- the system 12 includes a database server 62 which receives the transaction data via the raw data interface 30 .
- the raw data interface is an offline batch interface which periodically uploads the transaction data by a variety of means, but may also comprise a real-time connection.
- the database server 62 includes a relational database 64 and a multidimensional knowledge base 66 .
- the transaction data 52 , 54 , 56 , 58 , and 60 is stored in the relational database 64 , and a subset of the data translated to a multidimensional form in the knowledge base 66 .
- the knowledge base stores the data in a data cube manner operable for on-line analytical processing (OLAP) manipulation by an OLAP processor as is known to those skilled in the art.
- the knowledge base allows the data to be aggregated and extracted in a drill-up/drill down manner as required by the reports, described further below.
- An analysis engine 68 incorporated within the reporting function operates to access the transaction data via the database server 62 for generating reports 32 ( FIG. 2 ).
- the reports include a set of standard reports 70 a - h and ad-hoc reports 72 .
- the standard reports, 70 generally, contain an aggregate synopsis of quantitative computations about a particular subject under observation, such as an employee or retail store, according to a predetermined sequence of computations, and are described further below with respect to FIGS. 8 a - 8 j .
- the standard reports 70 are typically computed in real-time on demand.
- the ad-hoc reports 72 are provided via a third party reporting tool to retrieve the data from the database server 62 . In either case the reports 36 are employed in developing a hypothesis from which to derive developmental planning for the subject under observation.
- the reports 36 are invoked by a hypothesizer 74 .
- the hypothesizer 74 interprets the quantitative information in the reports 36 to allow qualitative comparisons and conclusions to be determined.
- the reports 36 include a number of fields about a subject under observation. Each field in the report has a performance score about the subject under observation. For each field, there is also a performance range indicative of a typical score and the variation from that score.
- a classifier 76 in the hypothesizer 74 compares the performance score to the performance range to derive a performance rank of the subject under observation for the concerned field. The performance rank is enumerated into several tiers across the performance range.
- the performance rank may have three tiers of low, average, and high (L, A, H), indicative of the performance of the subject under observation in that performance field.
- the performance rank may have other tiers, such as a two tiered yes/no (Y,N) scale or a ten point scale, for example.
- Each of the reports can be generated on a variety of levels of granularity, including granularity with respect to scope and with respect to time. Specifically, reports can be generated per employee, store, district, region, division, and company. Reports can also be generated to cover timing intervals including daily, weekly, monthly, quarterly, and yearly progress.
- the classifier 76 indicates a set of performance ranks concerning a particular subject under observation for a plurality of fields.
- the performance ranks are employed along with a type of the subject under observation to map to recommended actions ( 38 , FIG. 2 ) to be taken to improve the performance of the subject under observation.
- the type of the subject under observation includes sales employees and retail stores. Further, sales employees include the types of associate, advisor, and consultant.
- a mapper 78 in the hypothesizer 74 receives the performance ranks and the type of the subject under test to map to the recommended actions 38 . Based on the performance ranks and the type of the subject under observation, one or more recommended actions 38 are determined from the mapping.
- the mapping is a matrix form, described further below, which correlates the type of the subject under observation, the performance ranks, and the recommended actions. Other factors could be employed.
- the operation performed by the hypothesizer 74 can be performed in several ways.
- the quantitative reports are manually inspected and compared to the expected performance range.
- the mapping further comprises reference to the matrix of possible values and a listing of the corresponding recommended actions. Manual inspection in this manner further allows qualitative assessments to be made regarding performance rankings within the expected performance range.
- the hypothesizer 74 comprises an expert system (not shown) which receives the performance scores and type of the subject under observation, and computes the recommended actions according to a rule-based mechanism.
- the recommended actions 38 determined by the hypothesizer 74 indicate skills and knowledge which the subject under observation excels at, and should be rewarded for, and those for which improvement is called for.
- the recommended actions are sent to a manager 80 of the subject under observation for review and implementation.
- the recommended actions also indicate specific curriculum or review 82 to be undertaken at the learning center 60 .
- the learning center has a variety of curricula targeted at improvement of specific knowledge or skills indicated by the recommended actions.
- the recommended actions may also indicate skills and knowledge for practice 84 , to be undertaken at the point of sale 58 .
- manager 80 involvement, curriculum review 82 at the learning center, or skills and knowledge for practice 84 , or a combination may be indicated. Manager 80 involvement in decision making for implementing the recommended actions 38 from among the variety of curricula available via the learning center provides another level of qualitative assessment for the skill and knowledge development of the subject under observation.
- FIG. 5 is a block diagram of output retrieval.
- a manager 80 may access the system reports 36 via a variety of connections, such as the local store system 88 , a home office 92 , or other remote location 94 .
- the local store system 88 may, for example, also include the POS system 58 for the local store.
- Access to PIMS 12 occurs via a web/user interface 86 to access the reports 36 over the Internet 90 or other remote access network.
- a security schema 85 is employed to regulate access to PIMS 12 .
- the security schema 85 defines a role and privilege mechanism for viewing data from PIMS 12 .
- Users are authenticated through a password or other authentication process.
- privileges are defined based on the user's role within the organization, their need-to-know, and the tenuity and specificity of the data sought. For example, a new entry-level associate might be able to access their own performance scores, but not those of a colleague. Similarly, a manager needs to have access to data and reports concerning all sales employees under her, but need not have access to employee sales data from another region outside their responsibility. Other rules and checks can also be employed in the security schema.
- the learning center 60 comprises multimedia educational curricula focused at improving the specific skills and knowledge of the sales employee.
- the particular curriculum is selected based on the determined recommended action.
- the curriculum may be delivered electronically on the display of the learning center 60 from DVDs (Digital Video Discs), CDs (Compact Discs), and other optical and magnetic media, by print medium, such as workbooks and texts, or by a combination.
- Curriculum feedback such as exercises and tests may likewise be provided by a plurality of mediums.
- the learning center represents a library of educational resources including software, visual, audio, and printed mediums designed and tailored to address a particular skill or knowledge targeted for improvement.
- the learning center is a library of multimedia educational curricula marketed commercially by The Yacobian Group, LLC of Maynard, Mass., however, other developmental mechanisms for addressing skill and knowledge improvement may also be employed.
- FIG. 6 is a data flow diagram of the development cycle iteration similar to the data described above with respect to FIG. 6 .
- the association of PINS analysis is shown in relation to the multimedia learning center 60 activities aimed at improving the skills and knowledge of the subject under observation.
- the PIMS data inputs 102 are received via the transactional data interface, and comprise the transactional data sources 52 , 54 , 56 , 58 , and 60 .
- the PIMS output 110 includes the reports 36 and is employed in developing further hypotheses for improvement 104 .
- the recommended actions 38 suggested by the hypothesis are taken 106 , and the feedback mechanism 98 employed for the subsequent data measurement 108 via PIMS 12 .
- the output 100 comprises fresh transaction data 30 which complements the iterative cycle.
- the gathering, analysis and processing occurs within PIMS as shown by the line 112 , while the hypothesizing and actions occur in conjunction with the learning center 60 , as shown by the line 114 .
- FIGS. 7 a - 7 d show flowcharts of the operation of PIMS system of FIG. 4 .
- transaction data is gathered from a plurality of sources, as depicted at step 300 .
- the raw transaction data is transmitted via an interface 30 to the database server 62 , as shown at step 302 .
- the analysis engine 62 analyzes the data from the database server 62 to generate quantitative reports 36 , as depicted at step 304 .
- the reports may take a variety of forms, including the standard reports 70 predetermined to correspond to typical performance fields, and ad-hoc reports 72 , designed to allow custom queries by the user.
- the reports 36 are employed by a hypothesizer 74 to determine recommended actions 38 for improving skills and knowledge as proscribed by the reports, as disclosed at step 306 . From the hypothesizer, the recommended actions 38 are applied, as depicted at step 308 .
- the recommended actions may be implemented by a manager 80 , through multimedia curricula 82 via the learning center 60 , or by skill practice 84 , on the sales floor, as disclosed at steps 310 , 312 , and 314 , respectively.
- the results are measured as transaction data during the next gathering of transaction data gathering, as depicted at step 316 , and control reverts to step 300 for further analysis in an iterative manner.
- FIG. 7 b shows a flowchart of data gathering.
- a plurality of data interfaces to remote systems are identified, as depicted at step 320 , collectively 30 .
- data is gathered, or uploaded, to the database server 62 in PIMS 12 .
- the interface may be offline batch interfaces, real time, data entry, or other mode of communication, depending on the remote system.
- one or more data sets are uploaded.
- Corporate administrative, human resource, and sales and revenue projection/goal data is uploaded from the home office systems, as shown at step 322 .
- Learning center data based on the recommended actions pursued is uploaded, such as courses completed, tests taken, and skills attained, as shown at step 324 .
- Detailed POS data to determine performance matrices such as units per transaction (UPT), dollars per transaction (DPT), and transactions per hour (TPH), described further below, is uploaded from each local store system, as disclosed at step 326 .
- Customer traffic count data which may also be from a local store system or from a separate sensor-based system, is uploaded, as shown at step 328 .
- Home office data such as merchandising, store attribute, and human resource data for staffing information, is uploaded, as depicted at step 330 .
- Each data set is then written to the relational database 64 in a normalized form, as disclosed at step 331 .
- a check is performed to see if the data set is to be dimensionalized and stored in the multidimensional knowledge base 66 , as shown at step 332 . If the data is not to be mirrored in the knowledge base 66 , then control advances to step 338 . If it is, than the data set is transformed to a multidimensional data set, as depicted at step 334 . The data is then stored in the knowledge base 66 , as shown at step 336 . A check is performed to determine if there are any more uploaded data sets, as shown at step 338 . If there are more data sets, control reverts to step 332 , otherwise the database server is populated for this iteration of transaction data, as shown at step 340 .
- FIG. 7 c shows a flowchart of the analysis of results.
- PIMS 12 receives a request to generate a report, as depicted at step 350 .
- the analysis engine 68 determines which of the reports 36 to generate, as shown at step 352 . Depending on which report, the analysis engine selectively invokes generation of the particular report, as shown at steps 360 - 368 .
- a detail level for the report is selected as depicted at step 370 .
- the detail levels include sales employee, store, district, region, division, and company. Other levels could be similarly defined or omitted.
- the pertinent data is fetched from the database server 62 , as disclosed at step 372 .
- the quantitative performance fields for the report are generated, as shown at step 374 , and the report output, as depicted at step 376 .
- FIG. 7 d shows a flowchart of mapping and determination of recommended actions.
- a performance report is requested from PIMS 12 , as depicted at step 380 .
- a check is performed to determine if the report concerns a subject under observation of store or employee, as shown at step 382 .
- the subject under observation may be, for example, one of the three tiers of sales employees: associate, advisor, or consultant, or a store (POS) location. If the subject under observation is an employee, then key employee performance measures are determined, as depicted at step 384 . If the subject under observation is a store, then key store performance measures are determined, as depicted at step 385 .
- a predetermined performance range corresponding to the performance field is retrieved, as disclosed at step 386 .
- the performance range indicates expected values and typical statistical deviations, as derived from performance measures previously attained and other factors.
- the performance measures are then analyzed in light of the performance range, as shown at step 388 , to generate a performance score.
- a performance ranking is determined by mapping the performance score to the performance range, as shown at step 390 , to determine a discrete bin, such as “L”, “M”, and “H” for this performance field.
- the performance rankings are mapped to recommended actions using a recommended action matrix, as depicted at step 392 and discussed further below with respect to FIGS. 9 a - 9 d .
- the appropriate recommended actions are then implemented, as shown at step 394 , and may be implemented via curriculum and review 82 from the learning center 60 , by skill practice at the POS 84 , from managerial coaching 80 , or by a combination, depending on the particular recommended action, as depicted at steps 395 - 397 .
- the corresponding databases for storing the transaction data are then updated by another transaction data gathering, as shown at step 398 .
- FIGS. 8 a - 8 j show the standard reports 70 ( FIG. 4 ) generated by PIMS.
- each of the reports concerns a particular subject under observation, such as a particular employee or store.
- a daily productivity analysis 200 is shown.
- Each subject under observation, individual stores in this report, is shown in column 202 .
- the relevant performance fields are shown in the columns 204 , which indicate the performance scores of each subject under observation 202 for each performance field. Additional comparison fields for the last year and current week are also shown in columns 206 and 208 , respectively. Further, graphical illustrations of particular performance fields are shown.
- a net sales contribution 210 graph shows the relative contribution of each subject under observation, and a histogram of goal variance 212 illustrates relative achievement to facilitate comparison between subjects under evaluation.
- the performance scores can be compared to a predetermined performance range for the particular performance field.
- a performance ranking of low, medium, or high (L, M, H) is derived from the relative performance score within the performance range.
- other tier structures could also be employed.
- L low
- A average
- H high
- a net sales performance range might specify low (“L”) as 0-100, average (“A”) as 101-150, and high (“H”) as 151+.
- Connecticut 202 b and Boston 202 c have achieved an “A”
- the Massachusetts/Rhode Island area have achieved an “H” ranking
- New England has achieved a “L” ranking.
- the ranking is employed in mapping to recommended actions, described further below.
- FIG. 8 b shows another productivity analysis, encompassing a weekly timeframe, in which the subject under observation is the individual sales employee.
- the weekly productivity analysis 500 includes the performance fields # of transactions 501 , Units Per Transaction 502 , and Dollars Per Transaction 504 . These fields will be discussed further below with respect to FIGS. 9 a - 9 d.
- a monthly opportunity analysis 214 is shown.
- columns 216 show the performance scores, and columns 218 further refine the scores on an hourly basis.
- a graph of the conversion percentage performance score 220 is also shown.
- FIG. 8 d shows a weekly opportunity analysis 214 ′ reporting the performance of individual sales employees. This report is similar to the report in FIG. 8 c , except that the subject under observation 202 ′ is at the sales employee level, and the report covers a weekly timeframe.
- the report fields 218 ′ are similar to the report fields 218 in FIG. 8 c.
- a development analysis 220 is shown. This report concerns an individual subject under observation 202 , and includes performance fields shown by columns 222 . Of particular relevance are the performance scores for DPH 224 , UPT 226 , and # of transactions 228 , as these fields will be employed below in mapping to recommended actions.
- a staff status report 230 is shown. This report outlines the number of sales employees at each level. The number of each level of sales employee is shown in the fields 232 , and a graph showing the relative percentage 234 is also shown. This information may be employed in developing a staffing profile.
- a performance ranking 236 is shown.
- the performance ranking report ranks the top subjects under evaluation according one of the performance fields, net sales 240 in this case, however other fields could be employed in determining the ranking.
- the remaining performance fields are also shown in columns 238 .
- a leader board report 242 is shown.
- the column 244 is ordered based on the net sales performance field shown in column 246 , and a histogram of the net sales 248 is also shown, thus showing relative differences between the subjects under evaluation.
- a trending analysis report 250 is shown.
- Each of the subjects under evaluation is listed in column 252 .
- the net sales performance field is shown in columns 254 for both actual and goal figures, allowing comparison between the actual and goal figures along with the performance metrics SPH, DPT, UPT, and TPH.
- This report in an alternate embodiment, can also show proactive customer activities and staffing profile trends.
- a learning history 256 report is shown for a particular subject under observation 257 .
- This data comprises the learning center transaction data for indicating which curriculum have been undertaken a sales employee.
- a curriculum description 258 indicates the knowledge or skills that the course is intended to improve.
- a actual course description 262 is also provided.
- the sequence description 260 indicates the type of sales employee that the course is designed for, associate, advisor, or consultant.
- the course results are displayed in columns 264 , and are employed to indicate whether satisfactory results have been achieved for the particular skill or knowledge that the course is targeted.
- the performance ranking may be adjusted to allow for qualitative assessments to be made based on the quantitative reports.
- one or more of the performance scores may be employed in determining a ranking for mapping the subject to the recommended actions.
- Graphs are generally shown for performance scores deemed to be more pertinent to a particular performance ranking, but can be generated for other performance scores as well.
- ad hoc reports (not shown) may also be employed in determining a ranking of a particular subject under observation before mapping the subject to recommended actions.
- FIGS. 8 a - 8 j are intended as illustrative; a variety of other detail levels and reporting time intervals can be provided. Appendix A illustrates further examples of reports which may be employed. In alternate embodiments, other permutations and combinations of reports may be provided; Appendix A is not intended to limit the present invention except as recited in the appended claims.
- FIGS. 9 a - 9 d show mapping of performance range scores to recommended actions. Referring to FIGS. 9 a - 9 d , 8 b and 4 , and example of recommended action mapping is shown.
- An analysis of sales employee (subject under evaluation) E 1 is shown as report entry 510 .
- performance scores are as follows. For Number of Transactions 501 , a score of 260. For Units Per Transaction 502 , 2.5, and for Dollars Per Transaction DPT 504 , a performance score of 104.
- Sales employee E 1 is of sales employee type of associate, also as indicated by entry 510 .
- the associate recommended action table 512 is employed in conjunction with the associate performance range shown in Table I. It should be noted that Table I is for illustrative purposes only; other performance ranges and standards could be employed.
- Mapping the performance ranks into the recommended actions table for associates 512 indicates entry 516 (H, A, A), which determines two recommended action entries of 3 and a coaching action of “Congratulate on great job.”
- the coaching activity will be undertaken by the manager 80 , and the recommended action 3 maps further to a recommended action list 514 .
- the recommended action list 514 lists entry 518 , corresponding to curriculum 82 in sharing information to be pursued at the learning center 60 .
- the learning center 60 includes both a mechanism for administering the educational curricula and a mechanism for administering evaluations, or tests, which are indicative of the level of proficiency in a particular skill to which the curricula is directed at.
- the mechanism for administering the educational curricula is a PC platform coupled with a library of dedicated multimedia curriculum.
- the library of multimedia curriculum includes educational software and optional printed materials corresponding to each curriculum offering.
- the PC platform would be located at the store (POS) and may be integrated with the POS data system. Alternately, the PC platform may be independent.
- the tests are also provided by the learning center PC platform, and are administered to the sales employees and a resultant score stored as part of the transaction data from the learning center 60 .
- the test scores are used to indicate proficiency at a particular skill, which is in turn used to indicate understanding of a particular skill set.
- the sales employee practices the skill set on the sales floor. With satisfactory results, the manager advances the sales employee to the next sales employee level.
- the sales employees as defined herein include three types, or levels. Other levels may be defined, to include additional levels such as pre-associate, for example. Each sales employee level has a corresponding set of skills. Advancement to the next associate level is contingent upon proficiency in the core skill set of the current associate level.
- the three levels are as follows. An associate is a base level sales employee who has been certified by a store manager as having completed the associate learning curriculum, outlined below.
- a fourth level, pre-associate may refer to a sales employee-in-training who is in the process of attaining proficiency in the skill set of an associate.
- An advisor has attained proficiency in the associate level skill set and the advisor skill set, which is focused on advanced client activity as enumerated below.
- a consultant has attained proficiency in the associate skill set, advisor skill set and the consultant skill set, which is focused on proactive client activity.
- Other skill sets and sales employee advancement criteria may be defined. Skill set categories and the skills within them for each sales employee are illustrated in Tables II, III, and IV for associates, advisors, and consultants, respectively.
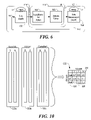
- FIG. 10 shows scaling of performance standards. Other factors may exist which affect the performance model shown above beyond the individual sales employee. For example for each of the sales employee types, there may exist several experience levels, such as beginner and advanced. Also, store volume and store location may also affect the ability of a sales employee to meet certain performance criteria.
- a set of performance standards 550 is shown for each of the three sales employee types. Each set of the performance standards 550 a , 550 b , and 550 c , corresponding to associate, advisor, and consultant, respectively, is shown with a beginner (B) set and an advanced (A) set.
- Each set of performance standards (Table 1) is modified by a scaling matrix 552 indicative of store characteristics which are pertinent to sales activity at the store.
- the characteristics are represented by scaling factors in the scaling matrix.
- the scaling matrix 552 has an axis representing store volume 554 and an axis representing store location type 556 .
- the store volume 554 indicates the relative number of sales in reference to other stores.
- the store location type 556 reflects relative customer profile and trading area characteristics.
- a sales employee working in a store located in a mall having average sales volume would be subject to a performance score scaling factor of 1.2, as shown by entry 558 .
- Other dimensions representing additional scaling factors may also be added to the scaling matrix. For example, a time component representing monthly or quarterly adjustments may be incorporated. Such a dimension can recognize trends such as, for example, retail sales tend to increase in December due to winter solstice holidays, followed by a slowdown in January.
- the sales employee's actual performance is then measured against the scaled performance standards and used to determine the L, A, H levels shown in FIGS. 9 a - 9 c
- Performance reports are also employed to determined optimal staffing profiles for a store, in addition to individual performance improvement and measurement as described above.
- store workflow there is an optimal mix of sales employees at various levels. Some stores may depend more on proactive sales typically generated by consultants, while other stores may experience significant foot traffic. Further, factors such as the conversion percentage—the number of foot traffic customers that result in a transaction—can indicate the likelihood that a customer will generate a transaction for an associate.
- a mall store may experience significant foot traffic, but few repeat customers. Therefore, the mall store may benefit from a large number of associates to accommodate the high number of foot traffic customers, but may not have a large base of repeat customers for proactive sales by consultants. Conversely, a suburban store may experience less foot traffic, and therefore need fewer associates and advisors, but may rely more heavily on proactive sales generated by the consultants.
- the staffing profile is employed to optimize the mix of employee types and hence the customer-focused skill sets on the floor, based on the transaction data and the POS environment.
- the programs for performance improvement and measurement as defined herein are deliverable to a computer in many forms, including but not limited to a) information permanently stored on non-writeable storage media such as ROM devices, b) information alterably stored on writeable storage media such as floppy disks, magnetic tapes, CDs, RAM devices, and other magnetic and optical media, or c) information conveyed to a computer through communication media, for example using baseband signaling or broadband signaling techniques, as in an electronic network such as the Internet or telephone modem lines.
- the operations and methods may be implemented in a software executable by a processor or as a set of instructions embedded in a carrier wave. Alternatively, the operations and methods may be embodied in whole or in part using hardware components, such as Application Specific Integrated Circuits (ASICs), state machines, controllers or other hardware components or devices, or a combination of hardware, software, and firmware components.
- ASICs Application Specific Integrated Circuits
Abstract
Description
| TABLE I | ||
| Performance Score | ||
| Low | Medium | High | ||
| (L) | (M) | (H) | ||
| # Trans | 0-10 | 11-50 | 51+ | ||
| UPT | 0-1.2 | 1.3-2.5 | 2.6+ | ||
| DPT | 0-40 | 41-110 | 111+ | ||
Referring to the
| TABLE II | ||
| Associate Level | ||
| Preparing Yourself: | ||
| Perform Strategic Activity | ||
| Acknowledge Clients | ||
| Assess Readiness | ||
| Engaging Clients: | ||
| Conduct Passby | ||
| Conduct Mirroring | ||
| Prepare Re-Engage | ||
| Share Information: | ||
| Gather Information | ||
| Share Knowledge | ||
| Say Goodbye | ||
| TABLE III | ||
| Advisor Level | ||
| Understanding Needs: | ||
| Recognize Triggers | ||
| Unlock Triggers | ||
| Gather Information | ||
| Creating Solutions: | ||
| Select Products | ||
| Create Stories | ||
| Present Solutions | ||
| Balancing Experiences: | ||
| Assess Readiness | ||
| Disengage Client | ||
| Engage Client | ||
| TABLE IV | ||
| Consultant Level | ||
| Offering Services: | ||
| Identify Candidates | ||
| Offer Opportunities | ||
| Record Information | ||
| Delighting Clients: | ||
| Set Next Step | ||
| Contact Clients | ||
| Conduct Appointments | ||
| Driving Business: | ||
| Develop Plan | ||
| Measure Activity | ||
| Grow Business | ||
Claims (55)
Priority Applications (1)
| Application Number | Priority Date | Filing Date | Title |
|---|---|---|---|
| US10/081,020 US7483842B1 (en) | 2001-02-21 | 2002-02-21 | System and method for determining recommended action based on measuring and analyzing store and employee data |
Applications Claiming Priority (2)
| Application Number | Priority Date | Filing Date | Title |
|---|---|---|---|
| US27056301P | 2001-02-21 | 2001-02-21 | |
| US10/081,020 US7483842B1 (en) | 2001-02-21 | 2002-02-21 | System and method for determining recommended action based on measuring and analyzing store and employee data |
Publications (1)
| Publication Number | Publication Date |
|---|---|
| US7483842B1 true US7483842B1 (en) | 2009-01-27 |
Family
ID=40275474
Family Applications (1)
| Application Number | Title | Priority Date | Filing Date |
|---|---|---|---|
| US10/081,020 Active 2025-02-02 US7483842B1 (en) | 2001-02-21 | 2002-02-21 | System and method for determining recommended action based on measuring and analyzing store and employee data |
Country Status (1)
| Country | Link |
|---|---|
| US (1) | US7483842B1 (en) |
Cited By (76)
| Publication number | Priority date | Publication date | Assignee | Title |
|---|---|---|---|---|
| US20050131747A1 (en) * | 2003-12-12 | 2005-06-16 | Shirley Vigil | Method, system, and storage medium for providing a disciplined approach to business management activities |
| US20060136248A1 (en) * | 2004-12-21 | 2006-06-22 | Mary Kay Inc. | Computer techniques for distributing information |
| US20060282305A1 (en) * | 2005-06-10 | 2006-12-14 | Gibson Paula Webb | Methods, systems, and storage mediums for managing accelerated performance |
| US20070022025A1 (en) * | 2005-06-29 | 2007-01-25 | Joel Litman | System and method for identifying accounting anomalies to help investors better assess investment risks and opportunities |
| US20080059292A1 (en) * | 2006-08-29 | 2008-03-06 | Myers Lloyd N | Systems and methods related to continuous performance improvement |
| US20080109294A1 (en) * | 2006-11-03 | 2008-05-08 | Richard Williams | Systems and methods of enhancing leads |
| US20080109299A1 (en) * | 2006-11-06 | 2008-05-08 | Genpact Global Holdings Sicar Sarl | Multi-tiered career progression system and method |
| US20080109445A1 (en) * | 2006-11-03 | 2008-05-08 | Richard Williams | Systems and methods of enhancing leads |
| US20080162487A1 (en) * | 2006-12-28 | 2008-07-03 | James Neal Richter | Predictive and profile learning sales automation analytics system and method |
| US20080288327A1 (en) * | 2007-05-15 | 2008-11-20 | Dentsu Retail Marketing Inc. | Store management system and program |
| US20090319344A1 (en) * | 2008-06-18 | 2009-12-24 | Tepper Samuel R | Assessment of sales force personnel for improvement of sales performance |
| US20100082376A1 (en) * | 2008-09-26 | 2010-04-01 | Microsoft Corporation | Suggesting things to do during time slots in a schedule |
| US20100250339A1 (en) * | 2009-03-30 | 2010-09-30 | Carla Villarreal | Maintaining viable provider-client relationships |
| US20100290617A1 (en) * | 2009-05-15 | 2010-11-18 | Microsoft Corporation | Secure outsourced aggregation with one-way chains |
| US20110137760A1 (en) * | 2009-12-03 | 2011-06-09 | Rudie Todd C | Method, system, and computer program product for customer linking and identification capability for institutions |
| US20110191697A1 (en) * | 2010-02-03 | 2011-08-04 | Victor Sumner | Method and system for discovery of local activities based on autonomous suggestion for discovery of local activities |
| US20110246260A1 (en) * | 2009-12-11 | 2011-10-06 | James Gilbert | System and method for routing marketing opportunities to sales agents |
| US8073731B1 (en) * | 2003-12-30 | 2011-12-06 | ProcessProxy Corporation | Method and system for improving efficiency in an organization using process mining |
| US20110307301A1 (en) * | 2010-06-10 | 2011-12-15 | Honeywell Internatioanl Inc. | Decision aid tool for competency analysis |
| US20120109700A1 (en) * | 2010-11-01 | 2012-05-03 | Target Brands, Inc. | Payroll System Optimization |
| US8175889B1 (en) | 2005-04-06 | 2012-05-08 | Experian Information Solutions, Inc. | Systems and methods for tracking changes of address based on service disconnect/connect data |
| US20120158465A1 (en) * | 2010-12-16 | 2012-06-21 | Hartford Fire Insurance Company | System and method for administering an advisory rating system |
| US8271378B2 (en) | 2007-04-12 | 2012-09-18 | Experian Marketing Solutions, Inc. | Systems and methods for determining thin-file records and determining thin-file risk levels |
| US20120323626A1 (en) * | 2011-06-20 | 2012-12-20 | Objective Logistics | Apparatus for scheduling staff based on normalized performance |
| US8364518B1 (en) | 2009-07-08 | 2013-01-29 | Experian Ltd. | Systems and methods for forecasting household economics |
| US8364509B1 (en) * | 2003-09-30 | 2013-01-29 | West Corporation | Systems methods, and computer-readable media for gathering, tabulating, and reporting on employee performance |
| US8484071B1 (en) * | 2008-05-02 | 2013-07-09 | Evotem, LLC | Telecom environment management operating system and method |
| US20130246341A1 (en) * | 2008-05-01 | 2013-09-19 | Salesforce.Com, Inc | System, method and computer program product for managing data created in an on-demand service from other data, utilizing a report |
| US8583593B1 (en) | 2005-04-11 | 2013-11-12 | Experian Information Solutions, Inc. | Systems and methods for optimizing database queries |
| US8606666B1 (en) | 2007-01-31 | 2013-12-10 | Experian Information Solutions, Inc. | System and method for providing an aggregation tool |
| US8639616B1 (en) | 2010-10-01 | 2014-01-28 | Experian Information Solutions, Inc. | Business to contact linkage system |
| US8725613B1 (en) | 2010-04-27 | 2014-05-13 | Experian Information Solutions, Inc. | Systems and methods for early account score and notification |
| US20140172477A1 (en) * | 2012-12-14 | 2014-06-19 | Wal-Mart Stores, Inc. | Techniques for using a heat map of a retail location to deploy employees |
| US8775299B2 (en) | 2011-07-12 | 2014-07-08 | Experian Information Solutions, Inc. | Systems and methods for large-scale credit data processing |
| US20140329210A1 (en) * | 2013-05-03 | 2014-11-06 | Sears Brands, L.L.C. | Learning management system |
| US8954459B1 (en) | 2008-06-26 | 2015-02-10 | Experian Marketing Solutions, Inc. | Systems and methods for providing an integrated identifier |
| US20150095120A1 (en) * | 2013-09-30 | 2015-04-02 | Ncr Corporation | Objective metrics measuring value of employees |
| US20150127431A1 (en) * | 2013-11-05 | 2015-05-07 | Wal-Mart Stores, Inc. | Performance Evaluation System for Stores |
| US9147042B1 (en) | 2010-11-22 | 2015-09-29 | Experian Information Solutions, Inc. | Systems and methods for data verification |
| US9342783B1 (en) | 2007-03-30 | 2016-05-17 | Consumerinfo.Com, Inc. | Systems and methods for data verification |
| US20160162910A1 (en) * | 2014-12-09 | 2016-06-09 | Verizon Patent And Licensing Inc. | Capture of retail store data and aggregated metrics |
| US20160196511A1 (en) * | 2015-01-05 | 2016-07-07 | Saama Technologies Inc. | Methods and apparatus for analysis of employee engagement and contribution in an organization |
| US20160224913A1 (en) * | 2015-02-03 | 2016-08-04 | Infosys Limited | Proactive employee retention through engagement indicator |
| US20160224912A1 (en) * | 2015-01-30 | 2016-08-04 | Ricoh Company, Ltd. | Information processing apparatus, and non-transitory recording medium |
| US20160260043A1 (en) * | 2015-03-04 | 2016-09-08 | Pandera Systems | System and method for determing employee performance and providing employee learning |
| US9529851B1 (en) | 2013-12-02 | 2016-12-27 | Experian Information Solutions, Inc. | Server architecture for electronic data quality processing |
| US9565079B1 (en) | 2013-01-10 | 2017-02-07 | F5 Networks, Inc. | Holographic statistics reporting |
| US9697263B1 (en) | 2013-03-04 | 2017-07-04 | Experian Information Solutions, Inc. | Consumer data request fulfillment system |
| US9898709B2 (en) | 2015-01-05 | 2018-02-20 | Saama Technologies, Inc. | Methods and apparatus for analysis of structured and unstructured data for governance, risk, and compliance |
| US9922298B2 (en) | 2012-12-12 | 2018-03-20 | International Business Machines Corporation | System and method for determining optimal asset configurations while minimizing disruption to existing business operations in a service delivery environment |
| US10078843B2 (en) | 2015-01-05 | 2018-09-18 | Saama Technologies, Inc. | Systems and methods for analyzing consumer sentiment with social perspective insight |
| US10102536B1 (en) | 2013-11-15 | 2018-10-16 | Experian Information Solutions, Inc. | Micro-geographic aggregation system |
| US10210530B1 (en) * | 2006-08-11 | 2019-02-19 | Infor (Us), Inc. | Selecting a report |
| US10262362B1 (en) | 2014-02-14 | 2019-04-16 | Experian Information Solutions, Inc. | Automatic generation of code for attributes |
| US20190243921A1 (en) * | 2018-02-05 | 2019-08-08 | Microsoft Technology Licensing, Llc | Sharing measured values of physical space parameters |
| US10388179B2 (en) | 2008-06-18 | 2019-08-20 | Accenture Global Solutions Limited | Analytics platform |
| US10410205B2 (en) | 2015-08-21 | 2019-09-10 | Samsung Electronics Co., Ltd. | Apparatus and method for performing payment transaction using dynamic MST configuration |
| US20190303838A1 (en) * | 2018-03-30 | 2019-10-03 | Atlassian Pty Ltd | Using a productivity index and collaboration index for validation of recommendation models in federated collaboration systems |
| US10438171B2 (en) * | 2016-01-28 | 2019-10-08 | Tata Consultancy Services Limited | Method and system for real-time human resource activity impact assessment and real-time improvement |
| US10474972B2 (en) * | 2014-10-28 | 2019-11-12 | Panasonic Intellectual Property Management Co., Ltd. | Facility management assistance device, facility management assistance system, and facility management assistance method for performance analysis based on review of captured images |
| CN111210309A (en) * | 2020-01-03 | 2020-05-29 | 上海丙晟科技有限公司 | Empty berth recommendation system based on market big data |
| US10699227B2 (en) | 2016-06-17 | 2020-06-30 | Accenture Global Solutions Limited | Workforce strategy insights |
| US10699556B1 (en) | 2019-03-01 | 2020-06-30 | Honeywell International Inc. | System and method for plant operation gap analysis and guidance solution |
| US10776359B2 (en) | 2015-01-05 | 2020-09-15 | Saama Technologies, Inc. | Abstractly implemented data analysis systems and methods therefor |
| US10943193B1 (en) * | 2018-05-03 | 2021-03-09 | Saverio Dalia | Food and beverage venue management system |
| US10963434B1 (en) | 2018-09-07 | 2021-03-30 | Experian Information Solutions, Inc. | Data architecture for supporting multiple search models |
| US10986136B1 (en) | 2013-09-30 | 2021-04-20 | F5 Networks, Inc. | Methods for application management and monitoring and devices thereof |
| US11227001B2 (en) | 2017-01-31 | 2022-01-18 | Experian Information Solutions, Inc. | Massive scale heterogeneous data ingestion and user resolution |
| US11238077B2 (en) * | 2019-05-29 | 2022-02-01 | Sap Se | Auto derivation of summary data using machine learning |
| US11341438B2 (en) | 2019-11-22 | 2022-05-24 | The Procter & Gamble Company | Provisioning and recommender systems and methods for generating product-based recommendations for geographically distributed physical stores based on mobile device movement |
| US20230004917A1 (en) * | 2021-07-02 | 2023-01-05 | Rippleworx, Inc. | Performance Management System and Method |
| US11568331B2 (en) | 2011-09-26 | 2023-01-31 | Open Text Corporation | Methods and systems for providing automated predictive analysis |
| US11599841B2 (en) | 2015-01-05 | 2023-03-07 | Saama Technologies Inc. | Data analysis using natural language processing to obtain insights relevant to an organization |
| WO2024006375A1 (en) * | 2022-06-28 | 2024-01-04 | Talent Highway Corporation dba Seed Talent | Systems and methods for monitoring and comparing performance metrics across a group of targets |
| US11880377B1 (en) | 2021-03-26 | 2024-01-23 | Experian Information Solutions, Inc. | Systems and methods for entity resolution |
| US11941065B1 (en) | 2019-09-13 | 2024-03-26 | Experian Information Solutions, Inc. | Single identifier platform for storing entity data |
Citations (42)
| Publication number | Priority date | Publication date | Assignee | Title |
|---|---|---|---|---|
| US5111391A (en) * | 1989-10-05 | 1992-05-05 | Mrs. Fields, Inc. | System and method for making staff schedules as a function of available resources as well as employee skill level, availability and priority |
| US5138638A (en) * | 1991-01-11 | 1992-08-11 | Tytronix Corporation | System for determining the number of shoppers in a retail store and for processing that information to produce data for store management |
| WO1997013229A1 (en) * | 1995-10-06 | 1997-04-10 | Sensormatic Electronics Corporation | Color-categorized pos station clerk performance evaluation systems and methods |
| US5684964A (en) * | 1992-07-30 | 1997-11-04 | Teknekron Infoswitch Corporation | Method and system for monitoring and controlling the performance of an organization |
| US5722418A (en) | 1993-08-30 | 1998-03-03 | Bro; L. William | Method for mediating social and behavioral processes in medicine and business through an interactive telecommunications guidance system |
| US5726914A (en) * | 1993-09-01 | 1998-03-10 | Gse Systems, Inc. | Computer implemented process and computer architecture for performance analysis |
| US5808908A (en) | 1994-05-31 | 1998-09-15 | Lucent Technologies, Inc. | Method for measuring the usability of a system |
| US5810747A (en) | 1996-08-21 | 1998-09-22 | Interactive Remote Site Technology, Inc. | Remote site medical intervention system |
| US5823781A (en) * | 1996-07-29 | 1998-10-20 | Electronic Data Systems Coporation | Electronic mentor training system and method |
| US5832458A (en) * | 1995-06-07 | 1998-11-03 | Electronic Data Systems Corporation | System and method for electronically auditing point-of-sale transactions |
| US5909669A (en) * | 1996-04-01 | 1999-06-01 | Electronic Data Systems Corporation | System and method for generating a knowledge worker productivity assessment |
| US5953707A (en) | 1995-10-26 | 1999-09-14 | Philips Electronics North America Corporation | Decision support system for the management of an agile supply chain |
| US5954510A (en) | 1996-12-03 | 1999-09-21 | Merrill David W. | Interactive goal-achievement system and method |
| US5980429A (en) * | 1997-03-12 | 1999-11-09 | Neurocom International, Inc. | System and method for monitoring training programs |
| US5987443A (en) * | 1998-12-22 | 1999-11-16 | Ac Properties B. V. | System, method and article of manufacture for a goal based educational system |
| US6016486A (en) | 1998-12-22 | 2000-01-18 | Ac Properties B.V. | System method and article of manufacture for a goal based system utilizing an activity table |
| US6029159A (en) | 1998-12-22 | 2000-02-22 | Ac Properties B.V. | System, method and article of manufacture for a simulation enabled accounting tutorial system |
| US6049779A (en) * | 1998-04-06 | 2000-04-11 | Berkson; Stephen P. | Call center incentive system and method |
| US6115693A (en) * | 1998-04-17 | 2000-09-05 | Andersen Consulting Llp | Quality center and method for a virtual sales and service center |
| US6119097A (en) * | 1997-11-26 | 2000-09-12 | Executing The Numbers, Inc. | System and method for quantification of human performance factors |
| US6125358A (en) | 1998-12-22 | 2000-09-26 | Ac Properties B.V. | System, method and article of manufacture for a simulation system for goal based education of a plurality of students |
| US6157808A (en) | 1996-07-17 | 2000-12-05 | Gpu, Inc. | Computerized employee certification and training system |
| WO2001002597A1 (en) * | 1999-07-02 | 2001-01-11 | Inalco S.P.A. | Process for the preparation of the polysaccharides k4 and k5 from escherichia coli |
| US6201948B1 (en) * | 1996-05-22 | 2001-03-13 | Netsage Corporation | Agent based instruction system and method |
| US20010008999A1 (en) | 1997-11-05 | 2001-07-19 | Bull Jeffrey A. | Method and system for tracking employee productivity in a client/server environment |
| US20010011280A1 (en) | 1998-04-14 | 2001-08-02 | Edward S. Gilbert | Computer-based training system |
| US6275812B1 (en) * | 1998-12-08 | 2001-08-14 | Lucent Technologies, Inc. | Intelligent system for dynamic resource management |
| US20010032195A1 (en) * | 2000-03-30 | 2001-10-18 | Graichen Catherine Mary | System and method for identifying productivity improvements in a business organization |
| US20010032120A1 (en) * | 2000-03-21 | 2001-10-18 | Stuart Robert Oden | Individual call agent productivity method and system |
| US20010034730A1 (en) * | 2000-03-22 | 2001-10-25 | Bhandari Inderpal S. | Data-driven self-training system and technique |
| US6324282B1 (en) * | 2000-03-02 | 2001-11-27 | Knowlagent, Inc. | Method and system for delivery of individualized training to call center agents |
| US20010056367A1 (en) * | 2000-02-16 | 2001-12-27 | Meghan Herbert | Method and system for providing performance statistics to agents |
| US20020010563A1 (en) * | 1999-06-15 | 2002-01-24 | S. Michael Ratteree | Method for achieving and verifying increased productivity in an industrial process |
| US20020035500A1 (en) * | 2000-06-05 | 2002-03-21 | Shinji Yoko | Multi-dimensional management method and system |
| US20020038235A1 (en) * | 2000-08-08 | 2002-03-28 | Dimitri Musafia | Productivity monitoring system and method |
| US6589055B2 (en) * | 2001-02-07 | 2003-07-08 | American Association Of Airport Executives | Interactive employee training system and method |
| US6633851B1 (en) * | 1999-10-01 | 2003-10-14 | B-50.Com, Llc | Systems and methods for generating custom reports based on point-of-sale data |
| US20030229529A1 (en) * | 2000-02-25 | 2003-12-11 | Yet Mui | Method for enterprise workforce planning |
| US6732079B1 (en) * | 1999-11-01 | 2004-05-04 | General Motors Corporation | Method of determining the best mix of regular and contract employees |
| US6970810B1 (en) * | 2000-07-31 | 2005-11-29 | Ncr Corporation | Method and apparatus for storing retail performance metrics |
| US7035808B1 (en) * | 1999-10-20 | 2006-04-25 | Avaya Technology Corp. | Arrangement for resource and work-item selection |
| US7093748B1 (en) * | 2000-07-31 | 2006-08-22 | Ncr Corporation | Method and apparatus for tracking retail performance metrics during a transaction at a point of sale station |
-
2002
- 2002-02-21 US US10/081,020 patent/US7483842B1/en active Active
Patent Citations (43)
| Publication number | Priority date | Publication date | Assignee | Title |
|---|---|---|---|---|
| US5111391A (en) * | 1989-10-05 | 1992-05-05 | Mrs. Fields, Inc. | System and method for making staff schedules as a function of available resources as well as employee skill level, availability and priority |
| US5138638A (en) * | 1991-01-11 | 1992-08-11 | Tytronix Corporation | System for determining the number of shoppers in a retail store and for processing that information to produce data for store management |
| US5684964A (en) * | 1992-07-30 | 1997-11-04 | Teknekron Infoswitch Corporation | Method and system for monitoring and controlling the performance of an organization |
| US5722418A (en) | 1993-08-30 | 1998-03-03 | Bro; L. William | Method for mediating social and behavioral processes in medicine and business through an interactive telecommunications guidance system |
| US5726914A (en) * | 1993-09-01 | 1998-03-10 | Gse Systems, Inc. | Computer implemented process and computer architecture for performance analysis |
| US5808908A (en) | 1994-05-31 | 1998-09-15 | Lucent Technologies, Inc. | Method for measuring the usability of a system |
| US5832458A (en) * | 1995-06-07 | 1998-11-03 | Electronic Data Systems Corporation | System and method for electronically auditing point-of-sale transactions |
| WO1997013229A1 (en) * | 1995-10-06 | 1997-04-10 | Sensormatic Electronics Corporation | Color-categorized pos station clerk performance evaluation systems and methods |
| US5953707A (en) | 1995-10-26 | 1999-09-14 | Philips Electronics North America Corporation | Decision support system for the management of an agile supply chain |
| US6151582A (en) | 1995-10-26 | 2000-11-21 | Philips Electronics North America Corp. | Decision support system for the management of an agile supply chain |
| US5909669A (en) * | 1996-04-01 | 1999-06-01 | Electronic Data Systems Corporation | System and method for generating a knowledge worker productivity assessment |
| US6201948B1 (en) * | 1996-05-22 | 2001-03-13 | Netsage Corporation | Agent based instruction system and method |
| US6157808A (en) | 1996-07-17 | 2000-12-05 | Gpu, Inc. | Computerized employee certification and training system |
| US5823781A (en) * | 1996-07-29 | 1998-10-20 | Electronic Data Systems Coporation | Electronic mentor training system and method |
| US5810747A (en) | 1996-08-21 | 1998-09-22 | Interactive Remote Site Technology, Inc. | Remote site medical intervention system |
| US5954510A (en) | 1996-12-03 | 1999-09-21 | Merrill David W. | Interactive goal-achievement system and method |
| US5980429A (en) * | 1997-03-12 | 1999-11-09 | Neurocom International, Inc. | System and method for monitoring training programs |
| US20010008999A1 (en) | 1997-11-05 | 2001-07-19 | Bull Jeffrey A. | Method and system for tracking employee productivity in a client/server environment |
| US6119097A (en) * | 1997-11-26 | 2000-09-12 | Executing The Numbers, Inc. | System and method for quantification of human performance factors |
| US6049779A (en) * | 1998-04-06 | 2000-04-11 | Berkson; Stephen P. | Call center incentive system and method |
| US20010011280A1 (en) | 1998-04-14 | 2001-08-02 | Edward S. Gilbert | Computer-based training system |
| US6115693A (en) * | 1998-04-17 | 2000-09-05 | Andersen Consulting Llp | Quality center and method for a virtual sales and service center |
| US6275812B1 (en) * | 1998-12-08 | 2001-08-14 | Lucent Technologies, Inc. | Intelligent system for dynamic resource management |
| US6125358A (en) | 1998-12-22 | 2000-09-26 | Ac Properties B.V. | System, method and article of manufacture for a simulation system for goal based education of a plurality of students |
| US5987443A (en) * | 1998-12-22 | 1999-11-16 | Ac Properties B. V. | System, method and article of manufacture for a goal based educational system |
| US6029159A (en) | 1998-12-22 | 2000-02-22 | Ac Properties B.V. | System, method and article of manufacture for a simulation enabled accounting tutorial system |
| US6016486A (en) | 1998-12-22 | 2000-01-18 | Ac Properties B.V. | System method and article of manufacture for a goal based system utilizing an activity table |
| US20020010563A1 (en) * | 1999-06-15 | 2002-01-24 | S. Michael Ratteree | Method for achieving and verifying increased productivity in an industrial process |
| WO2001002597A1 (en) * | 1999-07-02 | 2001-01-11 | Inalco S.P.A. | Process for the preparation of the polysaccharides k4 and k5 from escherichia coli |
| US6633851B1 (en) * | 1999-10-01 | 2003-10-14 | B-50.Com, Llc | Systems and methods for generating custom reports based on point-of-sale data |
| US7035808B1 (en) * | 1999-10-20 | 2006-04-25 | Avaya Technology Corp. | Arrangement for resource and work-item selection |
| US6732079B1 (en) * | 1999-11-01 | 2004-05-04 | General Motors Corporation | Method of determining the best mix of regular and contract employees |
| US20010056367A1 (en) * | 2000-02-16 | 2001-12-27 | Meghan Herbert | Method and system for providing performance statistics to agents |
| US20030229529A1 (en) * | 2000-02-25 | 2003-12-11 | Yet Mui | Method for enterprise workforce planning |
| US6324282B1 (en) * | 2000-03-02 | 2001-11-27 | Knowlagent, Inc. | Method and system for delivery of individualized training to call center agents |
| US20010032120A1 (en) * | 2000-03-21 | 2001-10-18 | Stuart Robert Oden | Individual call agent productivity method and system |
| US20010034730A1 (en) * | 2000-03-22 | 2001-10-25 | Bhandari Inderpal S. | Data-driven self-training system and technique |
| US20010032195A1 (en) * | 2000-03-30 | 2001-10-18 | Graichen Catherine Mary | System and method for identifying productivity improvements in a business organization |
| US20020035500A1 (en) * | 2000-06-05 | 2002-03-21 | Shinji Yoko | Multi-dimensional management method and system |
| US6970810B1 (en) * | 2000-07-31 | 2005-11-29 | Ncr Corporation | Method and apparatus for storing retail performance metrics |
| US7093748B1 (en) * | 2000-07-31 | 2006-08-22 | Ncr Corporation | Method and apparatus for tracking retail performance metrics during a transaction at a point of sale station |
| US20020038235A1 (en) * | 2000-08-08 | 2002-03-28 | Dimitri Musafia | Productivity monitoring system and method |
| US6589055B2 (en) * | 2001-02-07 | 2003-07-08 | American Association Of Airport Executives | Interactive employee training system and method |
Non-Patent Citations (19)
| Title |
|---|
| Achieving Organizational Excellenace Through the Perforamnce Measurement System American Productivity & Quality Center, 1999. * |
| Athanasspolous, Antreas D., Performance Improvement Decision Aid Systems (PIDAS) in Retailing Organizations Using Data Envelopment Analysis, The Journal of Productivity Analysis, vol. 6, 1995. * |
| Capillo, Joe, Sales Performance Accountability Furniture World, Jul. 1, 1998. * |
| Donthu, Naveen et al., Retail Productivity Assessment Using Data Envelope Analysis Journal of Retailing; vol. 74, no. 1, Sprin 1998. * |
| Fitz-Enz, Jac, The Mythology of Measuring Staff Performance Canadian Business Review, vol. 20, No. 1, Sprin 1993. * |
| Ford, Brian, Point-of-Sale: The Future Is the By-Product Retail Control, vol. 50, No. 1, Dec. 1981, Abstract. * |
| Graff, Kevin et al., Winning retail : a self assessment and instructional guide for independent retailers Industry Canada, Service Industries, 1997, OCLC: 49914092. * |
| Grant, Rebecca A. et al., Computerized Performance Monitors as Multidimensional Systems: Derviation and Application ACM Transactions on Information Systems, vol. 14, No. 2, Apr. 1996. * |
| Harrison, Chuck, Using In-Store Systems to Achieve a Competitive Advantage Retail Control, vol. 59, No. 1, Jan. 1991, Abstract. * |
| Jacobs, Bill, Operating stores; High octane execution Chain Store Age with Shopping Center Age, vol. 70, No. 1, Jan. 1994. * |
| Jensen, Anne J. et al., A Systems Management Approach for Improvement of Organization Perforamnce Measurement Systems Information-Knowledge-Systems Management, vol. 2, No. 2, Jan. 2000. * |
| Jones, Steven D., Work Group Performance Measurement and Feedback Group & Organization Studies, Sep. 1993, vol. 18, No. 3. * |
| Kahn, Robert J., Tailor-made training Sales and Marketing Management, vol. 149, No. 3, Mar. 1997, pp. 66-72. * |
| Kaydos, Will, Operational Performance Measurement: Increasing Total Productivity CRC Press, LLC., 1999, ISBN: 1-57444-099-3. * |
| Pearce, Michael R., The Retail Performance Dynamic Ivey Business Quarterly, vol. 62, No. 4, Summer 1998. * |
| Simons, Robert, Performance Measurement & Control Systems for Implementing Strategy Prentice Hall, 2000, ISBN: 0-13-234006-2. * |
| Taylor, Albert J., Salespersons and sales managers: A Descriptive Early Study of Topics and Perceptions of Retail Sales Performance Appraisals, Human Resource Development Quarterly, Vol. 10, No. 3, Fall 1999. * |
| Thomas, Rhonda R. et al., A process for evaluating retail store efficiency: a restricted DEA approach International Journal of Research in Marketing, vol. 15, 1998. * |
| Turning data in knowledge Chain Store Age, Jan. 1996. * |
Cited By (121)
| Publication number | Priority date | Publication date | Assignee | Title |
|---|---|---|---|---|
| US8364509B1 (en) * | 2003-09-30 | 2013-01-29 | West Corporation | Systems methods, and computer-readable media for gathering, tabulating, and reporting on employee performance |
| US20050131747A1 (en) * | 2003-12-12 | 2005-06-16 | Shirley Vigil | Method, system, and storage medium for providing a disciplined approach to business management activities |
| US7702532B2 (en) * | 2003-12-12 | 2010-04-20 | At&T Intellectual Property, I, L.P. | Method, system and storage medium for utilizing training roadmaps in a call center |
| US8407081B1 (en) | 2003-12-30 | 2013-03-26 | ProcessProxy Corporation | Method and system for improving effciency in an organization using process mining |
| US8073731B1 (en) * | 2003-12-30 | 2011-12-06 | ProcessProxy Corporation | Method and system for improving efficiency in an organization using process mining |
| US20060136248A1 (en) * | 2004-12-21 | 2006-06-22 | Mary Kay Inc. | Computer techniques for distributing information |
| US8175889B1 (en) | 2005-04-06 | 2012-05-08 | Experian Information Solutions, Inc. | Systems and methods for tracking changes of address based on service disconnect/connect data |
| US8583593B1 (en) | 2005-04-11 | 2013-11-12 | Experian Information Solutions, Inc. | Systems and methods for optimizing database queries |
| US7596507B2 (en) | 2005-06-10 | 2009-09-29 | At&T Intellectual Property, I,L.P. | Methods, systems, and storage mediums for managing accelerated performance |
| US20060282305A1 (en) * | 2005-06-10 | 2006-12-14 | Gibson Paula Webb | Methods, systems, and storage mediums for managing accelerated performance |
| US8234200B2 (en) * | 2005-06-29 | 2012-07-31 | Credit Suisse Securities (Usa) Llc | System and method for identifying accounting anomalies to help investors better assess investment risks and opportunities |
| US20070022025A1 (en) * | 2005-06-29 | 2007-01-25 | Joel Litman | System and method for identifying accounting anomalies to help investors better assess investment risks and opportunities |
| US20120254067A1 (en) * | 2005-06-29 | 2012-10-04 | Joel Litman | System and Method for Identifying Accounting Anomalies to Help Investors Better Assess Investment Risks and Opportunities |
| US10546251B1 (en) | 2006-08-11 | 2020-01-28 | Infor (US) Inc. | Performance optimization |
| US10210530B1 (en) * | 2006-08-11 | 2019-02-19 | Infor (Us), Inc. | Selecting a report |
| US20080059292A1 (en) * | 2006-08-29 | 2008-03-06 | Myers Lloyd N | Systems and methods related to continuous performance improvement |
| US8027871B2 (en) * | 2006-11-03 | 2011-09-27 | Experian Marketing Solutions, Inc. | Systems and methods for scoring sales leads |
| US8626563B2 (en) | 2006-11-03 | 2014-01-07 | Experian Marketing Solutions, Inc. | Enhancing sales leads with business specific customized statistical propensity models |
| US20080109294A1 (en) * | 2006-11-03 | 2008-05-08 | Richard Williams | Systems and methods of enhancing leads |
| US8135607B2 (en) | 2006-11-03 | 2012-03-13 | Experian Marketing Solutions, Inc. | System and method of enhancing leads by determining contactability scores |
| US8271313B2 (en) | 2006-11-03 | 2012-09-18 | Experian Marketing Solutions, Inc. | Systems and methods of enhancing leads by determining propensity scores |
| US20080109445A1 (en) * | 2006-11-03 | 2008-05-08 | Richard Williams | Systems and methods of enhancing leads |
| US20080109299A1 (en) * | 2006-11-06 | 2008-05-08 | Genpact Global Holdings Sicar Sarl | Multi-tiered career progression system and method |
| US8527324B2 (en) * | 2006-12-28 | 2013-09-03 | Oracle Otc Subsidiary Llc | Predictive and profile learning salesperson performance system and method |
| US20080162487A1 (en) * | 2006-12-28 | 2008-07-03 | James Neal Richter | Predictive and profile learning sales automation analytics system and method |
| US10078868B1 (en) | 2007-01-31 | 2018-09-18 | Experian Information Solutions, Inc. | System and method for providing an aggregation tool |
| US11443373B2 (en) | 2007-01-31 | 2022-09-13 | Experian Information Solutions, Inc. | System and method for providing an aggregation tool |
| US11908005B2 (en) | 2007-01-31 | 2024-02-20 | Experian Information Solutions, Inc. | System and method for providing an aggregation tool |
| US10891691B2 (en) | 2007-01-31 | 2021-01-12 | Experian Information Solutions, Inc. | System and method for providing an aggregation tool |
| US10402901B2 (en) | 2007-01-31 | 2019-09-03 | Experian Information Solutions, Inc. | System and method for providing an aggregation tool |
| US10650449B2 (en) | 2007-01-31 | 2020-05-12 | Experian Information Solutions, Inc. | System and method for providing an aggregation tool |
| US8606666B1 (en) | 2007-01-31 | 2013-12-10 | Experian Information Solutions, Inc. | System and method for providing an aggregation tool |
| US9619579B1 (en) | 2007-01-31 | 2017-04-11 | Experian Information Solutions, Inc. | System and method for providing an aggregation tool |
| US10437895B2 (en) | 2007-03-30 | 2019-10-08 | Consumerinfo.Com, Inc. | Systems and methods for data verification |
| US9342783B1 (en) | 2007-03-30 | 2016-05-17 | Consumerinfo.Com, Inc. | Systems and methods for data verification |
| US11308170B2 (en) | 2007-03-30 | 2022-04-19 | Consumerinfo.Com, Inc. | Systems and methods for data verification |
| US8271378B2 (en) | 2007-04-12 | 2012-09-18 | Experian Marketing Solutions, Inc. | Systems and methods for determining thin-file records and determining thin-file risk levels |
| US8738515B2 (en) | 2007-04-12 | 2014-05-27 | Experian Marketing Solutions, Inc. | Systems and methods for determining thin-file records and determining thin-file risk levels |
| US20080288327A1 (en) * | 2007-05-15 | 2008-11-20 | Dentsu Retail Marketing Inc. | Store management system and program |
| US20130246341A1 (en) * | 2008-05-01 | 2013-09-19 | Salesforce.Com, Inc | System, method and computer program product for managing data created in an on-demand service from other data, utilizing a report |
| US8484071B1 (en) * | 2008-05-02 | 2013-07-09 | Evotem, LLC | Telecom environment management operating system and method |
| US8775233B1 (en) * | 2008-05-02 | 2014-07-08 | Evotem, LLC | Telecom environment management operating system and method |
| AU2009202428B2 (en) * | 2008-06-18 | 2012-05-03 | Accenture Global Services Limited | Assessment of sales force personnel for improvement of sales performance |
| US10388179B2 (en) | 2008-06-18 | 2019-08-20 | Accenture Global Solutions Limited | Analytics platform |
| US20090319344A1 (en) * | 2008-06-18 | 2009-12-24 | Tepper Samuel R | Assessment of sales force personnel for improvement of sales performance |
| US8954459B1 (en) | 2008-06-26 | 2015-02-10 | Experian Marketing Solutions, Inc. | Systems and methods for providing an integrated identifier |
| US11157872B2 (en) | 2008-06-26 | 2021-10-26 | Experian Marketing Solutions, Llc | Systems and methods for providing an integrated identifier |
| US10075446B2 (en) | 2008-06-26 | 2018-09-11 | Experian Marketing Solutions, Inc. | Systems and methods for providing an integrated identifier |
| US11769112B2 (en) | 2008-06-26 | 2023-09-26 | Experian Marketing Solutions, Llc | Systems and methods for providing an integrated identifier |
| US8560371B2 (en) * | 2008-09-26 | 2013-10-15 | Microsoft Corporation | Suggesting things to do during time slots in a schedule |
| US20100082376A1 (en) * | 2008-09-26 | 2010-04-01 | Microsoft Corporation | Suggesting things to do during time slots in a schedule |
| US20100250339A1 (en) * | 2009-03-30 | 2010-09-30 | Carla Villarreal | Maintaining viable provider-client relationships |
| US8401883B2 (en) * | 2009-03-30 | 2013-03-19 | Transitions in Progress LLC | Maintaining viable provider-client relationships |
| US8607057B2 (en) * | 2009-05-15 | 2013-12-10 | Microsoft Corporation | Secure outsourced aggregation with one-way chains |
| US20100290617A1 (en) * | 2009-05-15 | 2010-11-18 | Microsoft Corporation | Secure outsourced aggregation with one-way chains |
| US8364518B1 (en) | 2009-07-08 | 2013-01-29 | Experian Ltd. | Systems and methods for forecasting household economics |
| US20110137760A1 (en) * | 2009-12-03 | 2011-06-09 | Rudie Todd C | Method, system, and computer program product for customer linking and identification capability for institutions |
| US20110246260A1 (en) * | 2009-12-11 | 2011-10-06 | James Gilbert | System and method for routing marketing opportunities to sales agents |
| US20110191697A1 (en) * | 2010-02-03 | 2011-08-04 | Victor Sumner | Method and system for discovery of local activities based on autonomous suggestion for discovery of local activities |
| US8725613B1 (en) | 2010-04-27 | 2014-05-13 | Experian Information Solutions, Inc. | Systems and methods for early account score and notification |
| US20110307301A1 (en) * | 2010-06-10 | 2011-12-15 | Honeywell Internatioanl Inc. | Decision aid tool for competency analysis |
| US8639616B1 (en) | 2010-10-01 | 2014-01-28 | Experian Information Solutions, Inc. | Business to contact linkage system |
| US20120109700A1 (en) * | 2010-11-01 | 2012-05-03 | Target Brands, Inc. | Payroll System Optimization |
| US9147042B1 (en) | 2010-11-22 | 2015-09-29 | Experian Information Solutions, Inc. | Systems and methods for data verification |
| US9684905B1 (en) | 2010-11-22 | 2017-06-20 | Experian Information Solutions, Inc. | Systems and methods for data verification |
| US8799058B2 (en) * | 2010-12-16 | 2014-08-05 | Hartford Fire Insurance Company | System and method for administering an advisory rating system |
| US20120158465A1 (en) * | 2010-12-16 | 2012-06-21 | Hartford Fire Insurance Company | System and method for administering an advisory rating system |
| US20150142488A1 (en) * | 2011-06-20 | 2015-05-21 | Matthew R. Grace | Method and system for scheduling staff based on normalized performance |
| US20120323626A1 (en) * | 2011-06-20 | 2012-12-20 | Objective Logistics | Apparatus for scheduling staff based on normalized performance |
| US8775299B2 (en) | 2011-07-12 | 2014-07-08 | Experian Information Solutions, Inc. | Systems and methods for large-scale credit data processing |
| US11568331B2 (en) | 2011-09-26 | 2023-01-31 | Open Text Corporation | Methods and systems for providing automated predictive analysis |
| US9922298B2 (en) | 2012-12-12 | 2018-03-20 | International Business Machines Corporation | System and method for determining optimal asset configurations while minimizing disruption to existing business operations in a service delivery environment |
| US9928472B2 (en) | 2012-12-12 | 2018-03-27 | International Business Machines Corporation | System and method for determining optimal asset configurations while minimizing disruption to existing business operations in a service delivery environment |
| US20140172477A1 (en) * | 2012-12-14 | 2014-06-19 | Wal-Mart Stores, Inc. | Techniques for using a heat map of a retail location to deploy employees |
| US9565079B1 (en) | 2013-01-10 | 2017-02-07 | F5 Networks, Inc. | Holographic statistics reporting |
| US9697263B1 (en) | 2013-03-04 | 2017-07-04 | Experian Information Solutions, Inc. | Consumer data request fulfillment system |
| US11954647B2 (en) | 2013-05-03 | 2024-04-09 | Transform Sr Brands Llc | Learning management system |
| US11263587B2 (en) | 2013-05-03 | 2022-03-01 | Transform Sr Brands Llc | Learning management system |
| US10423929B2 (en) | 2013-05-03 | 2019-09-24 | Transform Sr Brands Llc | Learning management system |
| US20140329210A1 (en) * | 2013-05-03 | 2014-11-06 | Sears Brands, L.L.C. | Learning management system |
| US10986136B1 (en) | 2013-09-30 | 2021-04-20 | F5 Networks, Inc. | Methods for application management and monitoring and devices thereof |
| US20150095120A1 (en) * | 2013-09-30 | 2015-04-02 | Ncr Corporation | Objective metrics measuring value of employees |
| US20150127431A1 (en) * | 2013-11-05 | 2015-05-07 | Wal-Mart Stores, Inc. | Performance Evaluation System for Stores |
| US10580025B2 (en) | 2013-11-15 | 2020-03-03 | Experian Information Solutions, Inc. | Micro-geographic aggregation system |
| US10102536B1 (en) | 2013-11-15 | 2018-10-16 | Experian Information Solutions, Inc. | Micro-geographic aggregation system |
| US9529851B1 (en) | 2013-12-02 | 2016-12-27 | Experian Information Solutions, Inc. | Server architecture for electronic data quality processing |
| US11847693B1 (en) | 2014-02-14 | 2023-12-19 | Experian Information Solutions, Inc. | Automatic generation of code for attributes |
| US10262362B1 (en) | 2014-02-14 | 2019-04-16 | Experian Information Solutions, Inc. | Automatic generation of code for attributes |
| US11107158B1 (en) | 2014-02-14 | 2021-08-31 | Experian Information Solutions, Inc. | Automatic generation of code for attributes |
| US10474972B2 (en) * | 2014-10-28 | 2019-11-12 | Panasonic Intellectual Property Management Co., Ltd. | Facility management assistance device, facility management assistance system, and facility management assistance method for performance analysis based on review of captured images |
| US20160162910A1 (en) * | 2014-12-09 | 2016-06-09 | Verizon Patent And Licensing Inc. | Capture of retail store data and aggregated metrics |
| US9875481B2 (en) * | 2014-12-09 | 2018-01-23 | Verizon Patent And Licensing Inc. | Capture of retail store data and aggregated metrics |
| US11599841B2 (en) | 2015-01-05 | 2023-03-07 | Saama Technologies Inc. | Data analysis using natural language processing to obtain insights relevant to an organization |
| US10776359B2 (en) | 2015-01-05 | 2020-09-15 | Saama Technologies, Inc. | Abstractly implemented data analysis systems and methods therefor |
| US20160196511A1 (en) * | 2015-01-05 | 2016-07-07 | Saama Technologies Inc. | Methods and apparatus for analysis of employee engagement and contribution in an organization |
| US10078843B2 (en) | 2015-01-05 | 2018-09-18 | Saama Technologies, Inc. | Systems and methods for analyzing consumer sentiment with social perspective insight |
| US9898709B2 (en) | 2015-01-05 | 2018-02-20 | Saama Technologies, Inc. | Methods and apparatus for analysis of structured and unstructured data for governance, risk, and compliance |
| US20160224912A1 (en) * | 2015-01-30 | 2016-08-04 | Ricoh Company, Ltd. | Information processing apparatus, and non-transitory recording medium |
| US20160224913A1 (en) * | 2015-02-03 | 2016-08-04 | Infosys Limited | Proactive employee retention through engagement indicator |
| US20160260043A1 (en) * | 2015-03-04 | 2016-09-08 | Pandera Systems | System and method for determing employee performance and providing employee learning |
| US10410205B2 (en) | 2015-08-21 | 2019-09-10 | Samsung Electronics Co., Ltd. | Apparatus and method for performing payment transaction using dynamic MST configuration |
| US10438171B2 (en) * | 2016-01-28 | 2019-10-08 | Tata Consultancy Services Limited | Method and system for real-time human resource activity impact assessment and real-time improvement |
| US10699227B2 (en) | 2016-06-17 | 2020-06-30 | Accenture Global Solutions Limited | Workforce strategy insights |
| US11681733B2 (en) | 2017-01-31 | 2023-06-20 | Experian Information Solutions, Inc. | Massive scale heterogeneous data ingestion and user resolution |
| US11227001B2 (en) | 2017-01-31 | 2022-01-18 | Experian Information Solutions, Inc. | Massive scale heterogeneous data ingestion and user resolution |
| US11093563B2 (en) * | 2018-02-05 | 2021-08-17 | Microsoft Technology Licensing, Llc | Sharing measured values of physical space parameters |
| US20190243921A1 (en) * | 2018-02-05 | 2019-08-08 | Microsoft Technology Licensing, Llc | Sharing measured values of physical space parameters |
| WO2019152199A1 (en) * | 2018-02-05 | 2019-08-08 | Microsoft Technology Licensing, Llc | Sharing measured values of physical space parameters |
| US20190303838A1 (en) * | 2018-03-30 | 2019-10-03 | Atlassian Pty Ltd | Using a productivity index and collaboration index for validation of recommendation models in federated collaboration systems |
| US11093873B2 (en) * | 2018-03-30 | 2021-08-17 | Atlassian Pty Ltd. | Using a productivity index and collaboration index for validation of recommendation models in federated collaboration systems |
| US10943193B1 (en) * | 2018-05-03 | 2021-03-09 | Saverio Dalia | Food and beverage venue management system |
| US10963434B1 (en) | 2018-09-07 | 2021-03-30 | Experian Information Solutions, Inc. | Data architecture for supporting multiple search models |
| US11734234B1 (en) | 2018-09-07 | 2023-08-22 | Experian Information Solutions, Inc. | Data architecture for supporting multiple search models |
| US10699556B1 (en) | 2019-03-01 | 2020-06-30 | Honeywell International Inc. | System and method for plant operation gap analysis and guidance solution |
| US11238077B2 (en) * | 2019-05-29 | 2022-02-01 | Sap Se | Auto derivation of summary data using machine learning |
| US11941065B1 (en) | 2019-09-13 | 2024-03-26 | Experian Information Solutions, Inc. | Single identifier platform for storing entity data |
| US11341438B2 (en) | 2019-11-22 | 2022-05-24 | The Procter & Gamble Company | Provisioning and recommender systems and methods for generating product-based recommendations for geographically distributed physical stores based on mobile device movement |
| CN111210309A (en) * | 2020-01-03 | 2020-05-29 | 上海丙晟科技有限公司 | Empty berth recommendation system based on market big data |
| US11880377B1 (en) | 2021-03-26 | 2024-01-23 | Experian Information Solutions, Inc. | Systems and methods for entity resolution |
| US20230004917A1 (en) * | 2021-07-02 | 2023-01-05 | Rippleworx, Inc. | Performance Management System and Method |
| WO2024006375A1 (en) * | 2022-06-28 | 2024-01-04 | Talent Highway Corporation dba Seed Talent | Systems and methods for monitoring and comparing performance metrics across a group of targets |
Similar Documents
| Publication | Publication Date | Title |
|---|---|---|
| US7483842B1 (en) | System and method for determining recommended action based on measuring and analyzing store and employee data | |
| US7426499B2 (en) | Search ranking system | |
| Goyal et al. | Applications of data mining in higher education | |
| US9280777B2 (en) | Operations dashboard | |
| Sandino | Introducing the first management control systems: evidence from the retail sector | |
| Coltman | Can superior CRM capabilities improve performance in banking | |
| US20060059028A1 (en) | Context search system | |
| Tweeten | Agricultural policy analysis tools for economic development | |
| US20150242793A1 (en) | Systems and methods for auto-optimization of gamification mechanics for workforce motivation | |
| Evans et al. | Who needs performance management? | |
| NZ569683A (en) | A method and system for measuring organisational culture | |
| Wiratmadja et al. | Drivers of innovation ambidexterity on small medium enterprises (SMEs) performance | |
| US20070130191A1 (en) | Method and system for analyzing effectiveness of compliance function | |
| US8095415B1 (en) | Human capital development framework | |
| US8473320B1 (en) | Method for statistical comparison of occupations by skill sets and other relevant attributes | |
| Reddick | Assessing local government revenue forecasting techniques | |
| Perng et al. | A service quality improvement dynamic decision support system for refurbishment contractors | |
| US20080275745A1 (en) | Method, computer program product and system for defining, measuring and maximizing relationship alignment and maturity | |
| US20050228713A1 (en) | Customer value chain business analysis | |
| US20050055194A1 (en) | Migration model | |
| Ashley et al. | Exploration of educational data mining in improving teaching quality | |
| Bii et al. | The influence of customer centric strategic approach for competitive advantage on customer satisfaction in CFC stanbic bank kenya limited | |
| Nataraj et al. | Options for Department of Defense total workforce supply and demand analysis: potential approaches and available data sources | |
| Leseiyo et al. | Influence of Staff Training on Performance of Public Universities in Kenya: A Case Study of Moi University, Nairobi Campus | |
| US20210295222A1 (en) | Web-integrated institutional research analytics platform |
Legal Events
| Date | Code | Title | Description |
|---|---|---|---|
| AS | Assignment |
Owner name: YACOBIAN GROUP, LLC, THE, MASSACHUSETTS Free format text: ASSIGNMENT OF ASSIGNORS INTEREST;ASSIGNORS:FUNG, KIN CHUNG;NURME, R. DAVID;YACOBIAN, ANTOINETTE;AND OTHERS;REEL/FRAME:012623/0586;SIGNING DATES FROM 20020215 TO 20020220 |
|
| STCF | Information on status: patent grant |
Free format text: PATENTED CASE |
|
| FPAY | Fee payment |
Year of fee payment: 4 |
|
| FPAY | Fee payment |
Year of fee payment: 8 |
|
| AS | Assignment |
Owner name: NURME, R. DAVID, MASSACHUSETTS Free format text: SECURITY INTEREST;ASSIGNOR:THE YACOBIAN GROUP, LLC;REEL/FRAME:043470/0411 Effective date: 20061201 |
|
| AS | Assignment |
Owner name: BLUEDAY, INC., MASSACHUSETTS Free format text: ASSIGNMENT OF ASSIGNORS INTEREST;ASSIGNOR:THE YACOBIAN GROUP, LLC;REEL/FRAME:047329/0176 Effective date: 20171129 |
|
| FEPP | Fee payment procedure |
Free format text: MAINTENANCE FEE REMINDER MAILED (ORIGINAL EVENT CODE: REM.); ENTITY STATUS OF PATENT OWNER: LARGE ENTITY |
|
| AS | Assignment |
Owner name: TULIP.IO INC., CANADA Free format text: ASSIGNMENT OF ASSIGNORS INTEREST;ASSIGNOR:BLUEDAY, INC.;REEL/FRAME:054302/0099 Effective date: 20200817 |
|
| FEPP | Fee payment procedure |
Free format text: 11.5 YR SURCHARGE- LATE PMT W/IN 6 MO, LARGE ENTITY (ORIGINAL EVENT CODE: M1556); ENTITY STATUS OF PATENT OWNER: LARGE ENTITY |
|
| MAFP | Maintenance fee payment |
Free format text: PAYMENT OF MAINTENANCE FEE, 12TH YEAR, LARGE ENTITY (ORIGINAL EVENT CODE: M1553); ENTITY STATUS OF PATENT OWNER: LARGE ENTITY Year of fee payment: 12 |
|
| AS | Assignment |
Owner name: PACIFIC WESTERN BANK, NORTH CAROLINA Free format text: SECURITY INTEREST;ASSIGNOR:TULIP.IO INC.;REEL/FRAME:055908/0198 Effective date: 20200611 |
|
| AS | Assignment |
Owner name: THE YACOBIAN GROUP, LLC, MASSACHUSETTS Free format text: RELEASE BY SECURED PARTY;ASSIGNOR:NURME, R. DAVID;REEL/FRAME:060210/0141 Effective date: 20220406 |
|
| AS | Assignment |
Owner name: TULIP.IO INC., CANADA Free format text: RELEASE BY SECURED PARTY;ASSIGNOR:PACIFIC WESTERN BANK;REEL/FRAME:059782/0427 Effective date: 20220429 |