US6285657B1 - System and method of scheduling data cells based upon sustainable cell rate and peak cell rate over a variable bandwidth channel - Google Patents
System and method of scheduling data cells based upon sustainable cell rate and peak cell rate over a variable bandwidth channel Download PDFInfo
- Publication number
- US6285657B1 US6285657B1 US09/406,965 US40696599A US6285657B1 US 6285657 B1 US6285657 B1 US 6285657B1 US 40696599 A US40696599 A US 40696599A US 6285657 B1 US6285657 B1 US 6285657B1
- Authority
- US
- United States
- Prior art keywords
- logic
- sum
- scr
- pcr
- threshold value
- Prior art date
- Legal status (The legal status is an assumption and is not a legal conclusion. Google has not performed a legal analysis and makes no representation as to the accuracy of the status listed.)
- Expired - Lifetime
Links
Images


Classifications
-
- H—ELECTRICITY
- H04—ELECTRIC COMMUNICATION TECHNIQUE
- H04Q—SELECTING
- H04Q11/00—Selecting arrangements for multiplex systems
- H04Q11/04—Selecting arrangements for multiplex systems for time-division multiplexing
- H04Q11/0428—Integrated services digital network, i.e. systems for transmission of different types of digitised signals, e.g. speech, data, telecentral, television signals
- H04Q11/0478—Provisions for broadband connections
-
- H—ELECTRICITY
- H04—ELECTRIC COMMUNICATION TECHNIQUE
- H04J—MULTIPLEX COMMUNICATION
- H04J3/00—Time-division multiplex systems
- H04J3/16—Time-division multiplex systems in which the time allocation to individual channels within a transmission cycle is variable, e.g. to accommodate varying complexity of signals, to vary number of channels transmitted
- H04J3/1682—Allocation of channels according to the instantaneous demands of the users, e.g. concentrated multiplexers, statistical multiplexers
-
- H—ELECTRICITY
- H04—ELECTRIC COMMUNICATION TECHNIQUE
- H04L—TRANSMISSION OF DIGITAL INFORMATION, e.g. TELEGRAPHIC COMMUNICATION
- H04L12/00—Data switching networks
- H04L12/54—Store-and-forward switching systems
- H04L12/56—Packet switching systems
- H04L12/5601—Transfer mode dependent, e.g. ATM
- H04L2012/5629—Admission control
- H04L2012/5631—Resource management and allocation
- H04L2012/5632—Bandwidth allocation
-
- H—ELECTRICITY
- H04—ELECTRIC COMMUNICATION TECHNIQUE
- H04L—TRANSMISSION OF DIGITAL INFORMATION, e.g. TELEGRAPHIC COMMUNICATION
- H04L12/00—Data switching networks
- H04L12/54—Store-and-forward switching systems
- H04L12/56—Packet switching systems
- H04L12/5601—Transfer mode dependent, e.g. ATM
- H04L2012/5638—Services, e.g. multimedia, GOS, QOS
- H04L2012/5646—Cell characteristics, e.g. loss, delay, jitter, sequence integrity
- H04L2012/5652—Cell construction, e.g. including header, packetisation, depacketisation, assembly, reassembly
Definitions
- the present invention relates generally to a system that allocates bandwidth on a network connection and, more specifically, to both a method and system of implementing a sustainable cell rate and a peak cell rate which dynamically allocate bandwidth on a variable bandwidth channel, allowing an idle channel to shift bandwidth to a busy one.
- Bandwidth is a measure of the capacity of a communication link, often expressed in bits per second, or bps. Bandwidth depends not only on a particular communication medium, such as fiber optics, coaxial cable, or twisted pair, but also on a communication protocol employed.
- a communication protocol is a collection of rules that two or more computers or devices employ to exchange data.
- TCP/IP Transmission Control Protocol/Internet Protocol
- ATM Asynchronous Transfer Mode
- TCP/IP is a packet based protocol.
- data is divided into multiple chunks, or packets, and each packet is addressed and transmitted through a communication medium.
- TCP/IP is flexible in that individual packets that are part of the same data stream may take different routes to the same destination.
- a source computer, an intermediate computer, or “router,” and a destination computer can adjust to communication medium congestion or failure by rerouting packets through alternative routes.
- individual packets within a single data stream may take different routes between the source computer and the destination computer.
- One drawback of TCP/IP is that the address of each packet is resolved at the source, destination and every router in between.
- Most communication protocols include layers; the three primarily employed in TCP/IP are a physical layer, a data link layer, and a network layer.
- the network layer passes packets to the data link layer
- the data link layer passes packets to physical layer
- the physical layer writes the packet in the form of electronic bits onto the communication medium.
- the physical layer is responsible for passing bits onto the connection medium, the data link layer for transmitting data between directly connected computers, and the network layer for routing the data from the source computer to the destination computer, through intermediate computers if necessary.
- ATM is a communication protocol of a type know as frame relay.
- frame relay a virtual circuit (VC) is established between applications on different computers. Each chunk of data, or frame, is relayed through the VC.
- the address resolution function of the network layer is performed only when the VC is first established.
- the network protocol layer of TCP/IP is therefore not applicable in an ATM transmission after channel setup because it is not necessary to resolve the address of each frame once the VC has been established. Instead, each computer maintains a table of VCs.
- the table includes such information as VC priority and status data and the appropriate output channel number for each input channel number.
- a connection is routed based upon a connection number instead of a network address; each frame is relayed based on information in a table which contains a specific output channel for each input channel.
- the source, router and destination computers merely look at the input channel number in a header structure of each data frame and relay the frame to a specific output channel based upon information contained within the table; no other address resolution is necessary and every frame takes the same route in their original order.
- ABR constant bit rate
- VBR variable bit rate
- UBR unspecified bit rate
- An ABR connection provides a guaranteed minimum capacity and allows data to be “bursted” at higher capacities when there is bandwidth that is not otherwise being utilized.
- Some advantages of a frame relay protocol such as ATM over a packet oriented connection such as TCP/IP are less overhead once a connection has been established, the ability to prioritize individual connections, and the data frames of frame relay are, unlike the packets of a packet oriented connection, delivered to the destination in the order they are sent.
- each frame is of variable length; in ATM, each frame, also referred to as a cell, is a fixed length, typically 53 bytes. Of the 53 bytes, 48 bytes are typically payload and 5 bytes contain header information such as the number of the VC on which the cell is transmitted.
- a segmentation and reassembly (SAR) controller typically guarantees to a VC a predefined sustainable cell rate (SCR), peak cell rate (PCR) or both.
- SCR is a measure of the VC's average transmission rate and may be flexible over short intervals so that the SAR controller can average transmission rates among several VCs.
- the PCR is a measurement of the minimum cell spacing of a particular VC and is typically a fixed limit the SAR controller will not allow the VC to exceed.
- a technique of allocating data cells by a segmentation and reassembly (SAR) controller for transmission on a network connection such as an ATM network connection employs step sizes defining a virtual channel's (VC) needed percentage of overall connection bandwidth to achieve the virtual channel's requested sustainable cell rate (SCR) without exceeding the virtual channel's peak cell rate (PCR).
- VC virtual channel's
- SCR sustainable cell rate
- PCR virtual channel's peak cell rate
- a VC's SCR step size is defined as the requested SCR divided by the connection's overall maximum cell rate.
- the VC's PCR step size is defined similarly, but based on the requested PCR.
- both a SCR step sum and a PCR step sum of that VC are compared to a threshold. If the SCR step sum exceeds the threshold, this VC has accumulated enough “bandwidth allocation” to send data. If the PCR step sum exceeds the threshold, enough time has elapsed since this VC has sent a cell to avoid exceeding the PCR limit. So if both the SCR step sum and the PCR step sum exceed the threshold, the VC is checked for available data and, if available, the cell is sent. If a cell is sent, then that VC's SCR step sum and PCR step sum are decremented.
- the SCR and PCR step sums for each active VC are incremented by that VC's SCR step size and PCR step size respectively. If the SCR step sum then exceeds some maximum “accumulated bandwidth” limit (generally fairly large), it is reduced below that limit. If the PCR step sum exceeds a PCR limit (typically 1), it is reset to that limit. Thus, the SCR step sum allows bandwidth to be “accumulated” for use when other VCs are idle, but the PCR step sum prevents the VC from exceeding its PCR.
- step sums need not be implemented, and other embodiments may simply employ the SCR step sum. Further, the step sums preferably allow simple integer arithmetic, reducing computation complexity.
- VC Voice Call Identity
- a next VC entry is examined each cell cycle, and if that VC has sufficient SCR bandwidth accumulated, PCR “delay time” accumulated, and data available, it sends. If data is not sent, a next VC entry in the list is examined for data to be sent. This is repeated until a VC sends data or the table has been completely searched. The next cell cycle, a next VC entry in the table is examined first.
- each entry can employ a pointer to the next different VC. Then, if that VC cannot transmit data during a particular cell cycle (either through lack of accumulated bandwidth, PCR constraints, or lack of available data), the SAR skips to the next different VC using the pointer.
- both VC step sums may be recalculated and the table recreated when ever the bandwidth of the connection either increases or decreases.
- the table is created essentially by creating a list of active VCs and then simulating the running SAR. That is, the next VC in the list of active VCs is examined to see if it meets the SCR and PCR bandwidth requirements to send a cell, and if so, that VC is placed as the next entry in the round-robin table. The next VC in the list is examined, and the process is repeated until the table has all its entries.
- the SCR and PCR step sums of the VCs allow the round robin table to be created based on the “virtual” running of the SAR.
- At least two tables are employed, one for constant bit rate (CBR) VCs and one for other VCs.
- CBR constant bit rate
- the requested bandwidth of the CBR VC table is never allowed to exceed overall available bandwidth, but the bandwidth of the first and second tables together can exceed the available bandwidth. Then, in operation, the first table is examined first, and if no cells are transmitted, the second table can use the surplus bandwidth.
- the SCR step sum allows a particular channel to “save up” bandwidth for use when other VCs are inactive because it accumulates bandwidth in excess of the threshold necessary to transmit.
- the step sum and threshold approach automatically shifts bandwidth between VCs based on their activity.
- One advantage is that the techniques may be implemented in software, providing the ability to modify or upgrade devices with less trouble and expense than if they were implemented in hardware. Software implemented devices are also typically less expensive to produce.
- a further advantage is that network connections with variable bandwidth such as an advanced digital subscriber line (ADSL) connection can dynamically reallocate resources to account for changing conditions.
- ADSL advanced digital subscriber line
- FIG. 1 a is a block diagram of a computing system S
- FIGS. 1 b and 1 c are block diagrams of two exemplary asynchronous transfer mode (ATM) networks
- FIG. 2 is an illustration of a typical ATM cell
- FIG. 3 a is an illustration of the logical relationship among a physical connection, virtual paths (VPs) and virtual circuits (VCs) in a typical ATM network;
- FIG. 3 b is an illustration of VC switching and VP switching in an ATM network
- FIG. 4 is a block diagram of an exemplary segmentation and reassembly (SAR) controller
- FIG. 5 is a block diagram illustrating the relationship between an ATM protocol stack and an open system interconnection (OSI) protocol stack;
- OSI open system interconnection
- FIGS. 6 a and 6 b are diagrams illustrating how a SAR controller such as the one described in FIG. 4 works with multiple VCs;
- FIG. 7 is a flowchart of an exemplary process during one cell cycle of the described embodiment.
- FIG. 8 is a flowchart of an exemplary process to poll a VC
- FIG. 9 is a flowchart of an exemplary process to create a transmission table
- FIGS. 10 a and 10 b illustrate the generation of a transmission table
- FIG. 11 illustrates a utilization of the transmission table of FIG. 10 b during cell cycles of a VC
- FIG. 12 illustrates how a PCR step sum prevents a VC from exceeding its PCR even though SCR bandwidth has accumulated in a SCR step sum
- FIG. 13 illustrates a exemplary priority scheme.
- FIG. 1 a illustrated is a block diagram of a computing system S that can implement the techniques of the disclosed embodiment.
- the computing system S includes a bus controller 17 , a processor 20 , synchronous dynamic access memory (SDRAM) 13 and a disk memory 15 .
- the processor 20 , the SDRAM 13 and the bus controller 17 are coupled to a peripheral component interconnect (PCI) bus 10 .
- PCI peripheral component interconnect
- the computer system S is controlled by an operating system (OS) 25 which is stored both in the disk memory 15 and the SRAM 13 and executes on the processor 20 .
- OS operating system
- a video display 23 and a keyboard 27 are also included in the computer system S, enabling human interaction with the computing system S.
- processor, bus and other hardware components are not critical to the techniques of the disclosed embodiments and are used as examples only.
- FIGS. 1 b and 1 c each show a typical configuration for an asynchronous transfer mode (ATM) network.
- ATM asynchronous transfer mode
- an ATM switch 110 is connected to a router — 1 111 and a router — 3 113 .
- a computer WS — 1 101 and a computer WS — 2 102 are connected to the router — 1 111 by means of a local area network (LAN) 130 .
- An ATM switch 120 is connected to a router — 2 121 and a router — 4 123 .
- a computer WS — 3 103 is connected to the router — 2 121 and a computer WS — 4 is connected to the router 123 .
- the computers 101 , 102 , 103 and 104 are computing systems similar to computing system S (FIG. 1 a ).
- the routers 111 , 113 , 121 and 123 may be computing system similar to computing system S or, in the alternative may each be a microprocessor specialized for the task of routing data.
- WS — 1 101 and WS — 2 102 can originate messages and may receive from each other messages routed through the router — 1 111 .
- WS — 3 103 can originate messages and WS — 4 104 may receive those messages through router — 2 121 , relayed by ATM switch 120 , and then through router — 4 123 .
- WS — 4 can also originate messages the are directed to WS — 3 103 in a similar manner by employing router — 4 123 , ATM switch 120 and router — 2 121 .
- the ATM switch 110 and the ATM switch 120 relay messages between each other, enabling router — 1 111 , router — 2 121 , router — 3 113 and router — 4 123 to pass messages between WS — 1 101 , WS — 2 102 , WS — 3 103 and WS — 4 104 .
- FIG. 1 c illustrated is an ATM switch 150 , an ATM switch 160 , and an ATM switch 170 .
- a router — 5 151 is connected to the ATM switch 150
- a router — 6 161 is connected to the ATM switch 160
- a router — 7 171 is connected to the ATM switch 170 .
- a computer WS — 5 105 is connected to router — 5 151 and a computer WS — 6 106 is connected to router — 6 161 .
- a computer WS — 7 107 and a computer WS — 8 108 are connected to router — 7 by means of a LAN 140 .
- the ATM switches 150 , 160 and 170 are also connected to each other enabling the switches 150 , 160 and 170 to transmit messages between WS — 5 105 , WS — 6 106 , WS — 7 107 and WS — 8 108 by means of an appropriate router or pair of routers in a manner similar to the process described in FIG. 1 b .
- the computers 105 , 106 , 107 and 108 are computing systems similar to computing system S (FIG. 1 a ).
- the routers 151 , 161 and 171 may be computing system similar to computing system S or, in the alternative may each be a microprocessor specialized for the task of routing data.
- FIG. 2 illustrated is a typical ATM cell format having a 4-bit generic flow control (GFC) field 301 , an 8-bit virtual path identifier (VPI) field 303 , a 16-bit virtual circuit identifier (VCI) field 307 , a 3-bit payload type (PT) field 311 , a cell loss priority (CLP) field 313 , an 8-byte header error control (HEC) field 315 , and a 48-byte information field 317 .
- GFC generic flow control
- VPI virtual path identifier
- VCI virtual circuit identifier
- CLP cell loss priority
- HEC 8-byte header error control
- the VPI 301 identifies the virtual path to which the cell is associated.
- the VCI 305 identifies the virtual circuit associated with a specific cell.
- the PT 311 identifies the type of information field 317 which is contained within the cell.
- the CLP 313 indicates what should be done with the cell in the event of an overflow. Typically, higher priority cells are retransmitted and lower priority cells are discarded.
- the HEC 315 contains check sum information that is employed to verify the accuracy of the remaining fields in the header 320 and, in some cases, may provide error correction.
- the information field 317 can come in a variety of formats depending upon the type of service requested.
- the information field typically contains another header field that can vary from 0 to 4 bytes.
- available services include a constant bit rate (CBR) service, a variable bit rate (VBR) service, an unspecified bit rate (UBR) service and an available bit rate (ABR) service.
- CBR constant bit rate
- VBR variable bit rate
- URR unspecified bit rate
- ABR available bit rate
- Each of the exemplary services may format the information field 217 in its own particular manner.
- FIG. 3 a illustrate is the logical relationship among physical connections, virtual paths (VPs), and virtual circuits (VCs) in an ATM network. Illustrated is a physical connection 201 having two virtual paths, a VP — 1 203 and a VP — 2 205 .
- the virtual path VP — 1 203 includes three virtual circuits, a VC — 1 207 , a VC — 2 209 and a VC — 3 211 .
- the virtual path VP — 2 205 is also comprised of three virtual circuits, a VC — 4 213 , a VC — 5 215 and a VC — 6 217 .
- the physical connection 201 makes a direct connection between two devices such as computers, routers or ATM switches like those illustrated in FIGS. 1 b and 1 c .
- the virtual paths VP — 1 203 and VP — 2 205 typically connect two computers and may span multiple physical connections 201 .
- the virtual paths VP — 1 203 and VP — 2 205 are bundles of VCs following the same route between two computers. It should be noted however that it is possible for a VC to be independent of any VP.
- the virtual circuits VC — 1 207 , VC — 2 209 and VC — 3 211 provide connections between applications and may span multiple virtual paths and physical connections.
- the virtual circuits VC_ 4213 , VC_ 5215 and VC_ 6217 each connect applications, possibly across multiple physical paths and physical connections.
- individual VCs and VPs are unidirectional.
- FIG. 3 b illustrated are examples of a VP switching 250 and a VC switching example 260 .
- VP — 2 205 first shown in FIG. 2 a , and a virtual path VP — 3 206 are both initially routed by means of a virtual path identifier (VPI) VPI — 1 255 .
- the data flow in VP — 2 205 is illustrated moving unidirectionally from left to right.
- the VP — 2 205 is switched from the VPI — 1 255 to a different VPI, VPI — 2 265 .
- the SAR controller 400 includes peripheral component interconnect (PCI) bus master logic 401 , PCI slave logic 405 and PCI drivers 403 that provide an interface between the SAR controller 400 and a PCI bus (not shown) and host processor (not shown). Also included in the SAR controller 400 are control/status registers and counters 407 , a serial EEPROM 409 , a direct memory access (DMA) incoming channel 415 and a DMA outgoing channel 417 . Both the DMA incoming channel 415 and the DMA outgoing channel are coupled to the PCI bus master logic by means of burst FIFOs 413 and 411 respectively.
- the SAR controller 400 includes a reassembly block 426 and a segmentation block 424 .
- the reassembly block 426 includes a reassembly coprocessor 427 , a receive (Rx) FIFO 429 and a physical Rx port 433 .
- the segmentation block 424 includes a segmentation coprocessor 425 , a transmit (Tx) FIFO 431 , a physical Tx port 435 and a xBR scheduler/ABR flow control manager 423 .
- the physical Rx port is connected to an ATM physical Rx interface 12 and the physical Tx port 435 is connected to an ATM physical transmit interface 14 .
- a memory arbiter is coupled between the control/status registers and counters 407 and both the reassembly coprocessor 427 and the segmentation coprocessor 425 . Also included in the SAR controller 400 are a 32-bit clock/timer 421 to provide a system timer and boundary scan logic 437 for testing purposes.
- the OSI stack 521 is a protocol standard developed by the International Standards Organization (ISO) located in Geneva, Switzerland.
- the top layer in the OSI protocol stack 521 is an application layer 523 .
- An application such as e-mail, file transfer or a client/server application originates and receives messages through the application layer 523 .
- the application layer 523 formats the message and passes it to a presentation layer 525 which processes the message into a user specified syntax such as the syntax necessary for data encryption. When finished, the presentation layer 525 passes the message to a session layer 527 which is responsible for monitoring starts, stops and governs transmission order.
- a transport layer 529 is responsible for ensuring delivery of a complete message.
- the transport layer 529 then passes the complete message on to a network layer 531 which routes the data to the correct network.
- the next layer to receive the message is a data link layer 533 which is responsible for transmitting the data from node to node.
- the bottom and final layer is a physical layer 535 which is responsible for passing the bits on to the physical connecting medium.
- the TCP/IP protocol deals with the data link 533 and the network layer 531 .
- a TCP/IP packet is received at the physical layer 535 , passed to the data link layer 533 where the single hop transmission is controlled and then passed to the network layer 531 where the packet's address is decoded and the packet's next appropriate hop is determined.
- the network layer 531 passes the packet back to the data link layer 533 which places control information into the packet to ensure the accuracy of the next network layer 532 specified next hop.
- the data link layer 533 passes the packet back to the physical layer 535 which formats the bit into a specific bit pattern appropriate for the physical transmission media.
- the physical layer 535 may frame each byte with start, stop and parity bits, or some combination of the three.
- the ATM protocol stack 501 is has a physical layer 517 , an ATM layer 515 , an ATM adaptation layer 513 , a control layer 509 , and a user layer 511 .
- the physical layer 517 corresponds to the physical layer 535 of the OSI protocol stack 521 .
- the ATM layer 515 and the ATM adaptation layer 513 correspond roughly to the data link layer 533 of the OSI protocol stack 521 .
- the control layer 509 of the ATM protocol stack 501 is responsible for setting up an ATM connection.
- the user layer 511 handles the communication of ATM cells once the control layer 509 has established the connection.
- a traffic shaping scheme 605 includes three VCs, a VC — 1 610 , a VC — 2 612 , and a VC — 3 614 .
- VC — 1 610 has been allocated 20% of a virtual path VP — 1 620 ;
- VC — 2 612 has been allocated 20% of the virtual path VP — 1 620 ;
- VC — 3 614 has been allocated 60% of the virtual path VP — 1 620 based upon the value of either their respective sustainable cell rates (SCR) or peak cell rates (PCR).
- SCR sustainable cell rates
- PCR peak cell rates
- a SCR represents an average required transmission rate of a VC and a PCR represents the minimum distance a group of data cells within an individual VC can be spaced from each other. If VP — 1 620 can transmit 2,000 data cells per second and VC — 1 610 requires a SCR of 400 cells per second, then the value of the SCR to the total ATM connection bandwidth is 400 divided by 2,000, or 20%. A value based upon a PCR value may be calculated in a similar fashion.
- VC — 1 610 contains three data cells to be transmitted, P-1, P-2 and P-3.
- VC — 2 612 contains two data cells to be transmitted, Q-1 and Q 2 .
- VC — 3 614 contains five data cells to be transmitted, R-1, R-2, R-3, R-4 and R-5.
- the first data cell transmitted is R-1, possibly because VC — 3 614 has a higher priority than either VC — 2 612 or VC — 1 610 .
- the second data cell transmitted is P-1 of VC — 2 612 ;
- the third data cell transmitted is R-2 of VC — 3 614 ;
- the fourth data cell transmitted is R-3 of VC — 3 614 ;
- the fifth data cell transmitted is Q-1 of VC — 2 612 ;
- the sixth data cell transmitted is P-2 of VC — 1 610 .
- the first five data cells transmitted one is from VC — 1 610 , one is from VC — 2 612 and three are from VC — 3 614 .
- the one of five ratio of VC — 1 610 and VC — 2 612 and the three of five ratio of VC — 3 614 corresponds to either the SCR or the PCR of the respective VCs.
- the PCR of VC — 3 614 is adjusted so that R-2 and R-3 can be adjacent and VC — 3 614 can utilize three of the first four data cell cycles.
- the SCR is typically flexible and the PCR is typically not.
- Process 700 is stored in the SDRAM 13 and executed in the processor 20 of the computing system S (FIG. 1 a ).
- process 700 may be stored in the EEPROM 409 and executed in the segmentation coprocessor 425 and the xBR scheduler/ABR flow control manager 423 of the SAR controller 400 (FIG. 4 ).
- Process 700 begins in a “Process Cell Cycle” step 701 and control proceeds immediately to step 703 where a transmission table 110 (FIG. 10 b ) is consulted to determine whether there is a VC available to process.
- the transmission table 110 has been used to determine whether there is a VC available to process.
- the transmission table 110 its use and creation are described in more detail below in conjunction with FIGS. 10 a , 10 b and 11 .
- control proceeds to a step A described in more detail below in conjunction with FIG. 8 .
- step 705 the process 700 determines whether the VC has already been examined within the current cell cycle. If the VC has already been examined, there is not need to examine it again. In that case, in the disclosed embodiment, a pointer stored in the transmission table in conjunction with the VC's listing in the transmission table 110 points to a next listing that contains a VC different than the selected VC.
- a list of all VCs polled within a cell cycle may be maintained and a listing can be selected that contains a VC both different than the selected VC and that has not been polled previously within the current cell cycle. Control returns to step 703 where again the process 700 determines whether there is another VC to process and the process 700 repeats.
- step 707 If in step 707 , the selected VC has not been polled, then control proceeds to step 709 where a SCR step sum and a PCR step sum are compared to a threshold value. If both the SCR step sum and a PCR step sum are greater than or equal the threshold value control proceeds to step 709 where the process 700 determines whether the VC has a data cell to transmit. If the VC has a data cell to transmit, then control proceeds to step 713 where the data cell is sent, and then to step 715 where both the SCR step sum and the PCR step sum are decremented, typically by the amount of the threshold value. Next, control proceeds to step 717 where the SCR step sum is set to zero if it is less than zero. In step 717 , the PCR step sum is also set to zero if it is less than zero. Control then proceeds to step 703 where the process repeats.
- step 709 If in step 709 either the SCR step sum or the PCR step sum are less than the threshold value, control proceeds immediately to step 703 . Control also proceeds to step 703 if the specified VC does not have data to send in step 711 .
- FIG. 8 illustrated is a flowchart of a “Update Active VCs” process 800 that is performed when process 700 reaches stage A as described above in conjunction with FIG. 7 .
- Control begins in step 801 and proceeds immediately to step 803 where a first active VC is selected. Once the first VC is selected, control proceeds to step 805 where the SCR step sum is incremented by the SCR step size and the PCR step sum is incremented by the PCR step size. Control then proceeds to step 807 where, if the SCR step size is greater than a SCR step size maximum, then the SCR step sum is set to the value of the SCR step size maximum.
- Control proceeds to step 809 where, if the PCR step sum is greater than a PCR step sum maximum, then the PCR step sum is set to the value of the PCR step sum maximum.
- the SCR step size maximum is typically set to a high number relative to a PCR step size maximum, which is typically set to a low integer value such as ‘1’ or ‘2’.
- step 809 control proceeds to step 811 where the process 800 determines whether there are more VCs to update. In there are no more VCs to update, control proceeds to step 815 where the Update Active VCs process 800 is complete. If there are more VCs to update in step 811 , then control proceeds to step 813 where a next active VC is selected. Control then proceeds to step 805 where the next VC is updated as described above. Process 800 continues through steps 805 , 807 , 809 , 811 and 813 until it is determined in step 811 that all active VCs have been updated.
- Process 900 begins in step 901 and control proceeds immediately to step 903 where a SCR step size and a PCR step size for each VC is calculated. Once these calculations are complete, control proceeds to step 905 where the transmission table described above in conjunction with FIG. 9 is generated. The generation of the transmission table is described in detail below in conjunction with FIGS. 10 a and 10 b . Once the generation of the transmission table is completed, control proceeds to step 907 where the Add/Remove VC process 900 is complete.
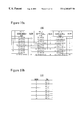
- FIG. 10 a is a table 100 showing values of calculations made during a simulation of several cell cycles of the traffic shaping scheme of the disclosed embodiment.
- the values of the calculations shown in FIG. 10 a are used to generate a transmission table 110 which is shown in FIG. 10 b .
- every VC is assumed to have data ready when ever it is “permitted” to send; however, the VCs do not actually send data during the simulation but instead write their name into a next open position of table 110 .
- a SCR step sum is initialized for each VC by setting each equal to the corresponding SCR step size, 0.2 for VC — 1, 0.3 for VC — 2 and 0.5 for VC — 3.
- the simulation then proceeds in a round robin fashion through the active VCs adding the corresponding SCR step size to each SCR step sum and determining, if this were not a simulation, whether the corresponding VC would send. If the VC would send, its name is placed in the next available position of table 110 .
- the value of the SCR step sum of VC — 1 is initialized to the value of the SCR step size of VC — 1, or 0.3.
- a threshold value in this example 1.0
- the name “VC — 1” would be placed into the table at the next available position, or position 1.
- the SCR step sum is less than the threshold valus so no entry is made into the table.
- the final calculation for VC — 1 in this iteration is adding the value of the VC — 1's SCR step size to VC — 1's SCR step sum.
- the SCR step sum is initialized to 0.3, which is the value of VC — 2's step size, and the SCR step sum is compared to the threshold value. Since the SCR step sum is less than the threshold, no entry is added to the transmission table.
- VC — 2's SCR step size is then added to VC — 2's SCR step sum.
- the same calculations are performed for VC — 3 with the same results. Having processed each VC, the generation moves to a second iteration. In iteration 2, VC — 1 and VC — 2 are processed again with the same results.
- the name “VC — 1” is written into table 110 at position 4, the name “VC — 3” at position 5, “VC — 2” at position 6, “VC — 3” at position 7, “VC — 1” at position 8, “VC — 2” at position 9 and, finally, the name “VC — 3” is written into the table at position 10, filling out this exemplary transmission table.
- step sizes and step sums are computationally more efficient.
- fraction values for step sizes are shifted up to integer values, as are the corresponding threshold values. For example, using decimal values, a step size of 0.5 wold be shifted one decimal point to 5.0 and a corresponding threshold value of 1.0 would then become 10.
- FIG. 11 illustrated is the use of the transmission table 110 in conjunction with the SCR step sums and SRC step sizes to determine which VC should be permitted to send a data cell when a connection is over subscribed.
- this description of omits the PCR step sum calculations based upon the PCR step size because they are similar to the calculations for the SCR step sum based upon the SCR step size.
- the total of the SCR step sizes in this example is 1.5 (0.3+0.4+0.8) which indicates that this connection is 50% over subscribed.
- every VC is assumed to have data to transmit and every SCR step sum is initialized to the threshold value.
- the first VC polled is VC — 3 because it is listed first in the transmission table 110 . Since its SCR step sum is greater than or equal to the threshold value, VC — 3 is allowed to send a data cell as indicated by a “Y” in the corresponding “Send” column. VC — 3's step sum is decremented by the threshold value and the SCR step sums of each VC in the connection is incremented by the corresponding SCR step size. In each iteration, one VC is permitted to transmit because each iteration corresponds to one cell cycle.
- VC — 2 is polled because it is listed in the next position in table 110 , position 2. Because is meets the criteria, it is permitted to send; its SCR step sum is decremented; and, the SCR step sum of each VC is incremented by the corresponding SCR step size. The VCs continue to send in the order that they are listed in the transmission table 110 through iteration 10.
- the transmission table 110 rotates the polling order in order to proportionally share the available bandwidth when the bandwidth is over subscribed.
- each VC had data to transmit provided that the other criteria for transmission were met.
- the VCs were permitted to transmit in proportion to their SCRs. None of the VCs received the cell cycles they had requested but the cell cycles were allocated on a pro rate basis.
- each VC does not necessarily have data to send even though it meets all the other criteria (its name is in the current position of the table 110 and its SCR step sum is not less than the threshold). Having allowed VC — 3 whose name is listed in position 10 of table 110 transmit data during iteration 10, VC — 3 is also has the next opportunity because it is listed in position 1 of table 110 . In other words, the polling list is repeated from the top once it reaches the end. In this example, however, VC — 3 does not have a cell to transmit as indicated by a “X” in the corresponding Send column.
- the next VC listed in table 110 position 2 is VC — 2 and it also does not have data to send. Even though VC — 3 is listed next in position 3 of table 110 , there is no need to check it again because it was just checked.
- a pointer (not shown) corresponding to a specific row in table 110 specifies a next row that does not repeat the VC listed in the specified row and the calculations can proceed directly to the next row that contains a VC that is different form the one that has just been checked and determined not ready to transmit.
- the next row that is different is position 4 which contains VC — 1.
- all criteria are met and VC — 1 transmits a data cell.
- a list of VCs that have been polled within a specific iteration or cell cycle is maintained, and time and processing is saved by skipping directly to a VC that has not yet been polled within the specific iteration.
- VC — 3 is polled because it is listed in position 5 of table 110 and, once again it is not ready.
- VC — 2 is then polled because it is listed in position 6. This time VC — 2 meets the criteria and sends a data cell.
- VC — 3 listed in position 7, is not ready to send so VC — 1, listed in position 8, is polled.
- VC — 1 may have data but it is not permitted to transmit because its SCR step sum is less than the threshold value.
- VC — 2 listed in position 9 of table 110 , is polled and is not ready to send.
- all three VCs in this example have been polled and are either unable to make the threshold requirement or do not have data to send.
- iteration 13 would pass without a data cell being transmitted.
- a second pass can made using either a reduced threshold value or a “scaled” SCR step sum in order to permit a VC to transmit and thus avoid a wasted cell cycle.
- FIG. 12 illustrated is a PCR table 130 that shows how implementing a maximum limit on a PCR step sum can enable a VC to “catch up” to a SCR allotment of data cells without exceeding its PCR allotment.
- the VC's SCR step size is 0.4, which indicates that this VC should typically utilize 40% of the bandwidth of its connection.
- the VC's PCR step size is 0.6 indicating that this VC is typically not permitted to utilize more than 60% of the bandwidth of the connection.
- the exemplary VC is blocked, causing its SCR step sum to grow from 0.4 in iteration 1 to 4.8 in iteration 12.
- the VC's PCR step sum is capped at a PCR step sum maximum value of 2 and, having reached that maximum in iteration 3, is still at that limit at iteration 12.
- the exemplary VC is unblocked and, because its SCR step sum and PCR step sum are greater than or equal to the threshold value and the VC has data to send, it is allowed to transmit.
- both the SCR step sum and the PCR step sum are greater than the threshold value and the VC is permitted to transmit in those iterations as well.
- the SCR step sum is greater than or equal to the threshold value but the PCR step sum, 0.6, is less than the threshold value. It should be noted that absent the condition imposed by the PCR step sum, the VC would be permitted to transmit for approximately the next 8 iterations. Of course, then the PCR of the VC would be exceeded for the next 8 iterations.
- the PCR step sum is less than the threshold value and the VC is prevented from transmitting. From iteration 17 through 29, the PCR step sum is such that the VC transmits in three out of every five cell cycles, or 60% of the time. A sixty percent transmission rate corresponds to the VC's PCR.
- the data cells that were backlogged during iterations 1 through 12 are eventually transmitted as indicated by the value of the SCR step sum, 0.6, in iteration 29.
- both the SCR step sum and the PCR step sum are less than the threshold value and, assuming that the VC has data to send and remains unblocked, the VC will then settle into a transmission rate that is equal the SCR.
- the VC “bursted” three data cells, exceeding the VC's PCR for that interval. This deviation form the PCR may, depending upon the circumstances, be unacceptable and can be prevented by setting the PCR step sum maximum to a value of 1.
- the VC has transmitted 11 times for a SCR of approximately thirty-seven percent, or 0.37.
- the VC also transmitted 11 times for a rate of sixty-one percent, or 0.61. Therefore, the PCR of the VC was maintained throughout the thirty iterations and the VC was able to clear a backlog of data cells by borrowing data cells from other VCs as explained above in conjunction with FIGS. 10 a , 10 b and 11 .
- a table 140 similar to table 110 described above in conjunction FIG. 11 b is generated based on the constant bit rate (CBR) VCs of an ATM connection. VCs using other ATM service types are placed in a table 150 .
- a CBR VC such as a real time video stream is very susceptible to loss of data and timing fluctions. Therefore, the a CBR table is purposely not over subscribed.
- the CBR table 140 is under subscribed and the VCs that are entries are polled before any entries in table 150 are polled. In that way, CBR VCs can have guaranteed service and the other VCs can share any remaining bandwidth on a pro rata basis if necessary.
Abstract
Description
Claims (26)
Priority Applications (3)
| Application Number | Priority Date | Filing Date | Title |
|---|---|---|---|
| US09/406,965 US6285657B1 (en) | 1999-09-28 | 1999-09-28 | System and method of scheduling data cells based upon sustainable cell rate and peak cell rate over a variable bandwidth channel |
| EP00965126A EP1216529A4 (en) | 1999-09-28 | 2000-09-19 | System and method of scheduling data cells over a variable bandwidth channel |
| PCT/US2000/025594 WO2001024423A1 (en) | 1999-09-28 | 2000-09-19 | System and method of scheduling data cells over a variable bandwidth channel |
Applications Claiming Priority (1)
| Application Number | Priority Date | Filing Date | Title |
|---|---|---|---|
| US09/406,965 US6285657B1 (en) | 1999-09-28 | 1999-09-28 | System and method of scheduling data cells based upon sustainable cell rate and peak cell rate over a variable bandwidth channel |
Publications (1)
| Publication Number | Publication Date |
|---|---|
| US6285657B1 true US6285657B1 (en) | 2001-09-04 |
Family
ID=23610077
Family Applications (1)
| Application Number | Title | Priority Date | Filing Date |
|---|---|---|---|
| US09/406,965 Expired - Lifetime US6285657B1 (en) | 1999-09-28 | 1999-09-28 | System and method of scheduling data cells based upon sustainable cell rate and peak cell rate over a variable bandwidth channel |
Country Status (3)
| Country | Link |
|---|---|
| US (1) | US6285657B1 (en) |
| EP (1) | EP1216529A4 (en) |
| WO (1) | WO2001024423A1 (en) |
Cited By (8)
| Publication number | Priority date | Publication date | Assignee | Title |
|---|---|---|---|---|
| WO2002017552A1 (en) * | 2000-08-24 | 2002-02-28 | Ocular Networks | Apparatus and method for facilitating data packet transportation |
| US6449252B1 (en) * | 1999-06-18 | 2002-09-10 | Cisco Technology, Inc. | ATM path cell scheduling for constant and variable bit rate traffic |
| US20030142692A1 (en) * | 2002-01-31 | 2003-07-31 | Nagao Shimada | Network side transmission apparatus and method for controlling variable traffic rate by dynamic bandwidth allocation |
| US20040125809A1 (en) * | 2002-12-31 | 2004-07-01 | Jeng Jack Ing | Ethernet interface over ATM Cell, UTOPIA xDSL in single and multiple channels converter/bridge on a single chip and method of operation |
| US6973047B1 (en) * | 1998-11-10 | 2005-12-06 | At&T Corp. | System and method for providing dynamic bandwidth on demand |
| US7114000B1 (en) * | 1999-11-29 | 2006-09-26 | Cisco Technology, Inc. | Scheduling network traffic using multiple logical schedule tables |
| US7349406B1 (en) * | 2001-10-18 | 2008-03-25 | Network Equipment Technologies Inc. | Method and apparatus for virtual network connection merging |
| CN100442764C (en) * | 2005-06-06 | 2008-12-10 | 华为技术有限公司 | Controlling method for SAR treatment chip transmitting congestion |
Citations (10)
| Publication number | Priority date | Publication date | Assignee | Title |
|---|---|---|---|---|
| US5392280A (en) * | 1994-04-07 | 1995-02-21 | Mitsubishi Electric Research Laboratories, Inc. | Data transmission system and scheduling protocol for connection-oriented packet or cell switching networks |
| US5742765A (en) * | 1996-06-19 | 1998-04-21 | Pmc-Sierra, Inc. | Combination local ATM segmentation and reassembly and physical layer device |
| US5745694A (en) * | 1994-08-30 | 1998-04-28 | Nec Corporation | Network resource reservation with admission and link control functions separated for expandability and high-speed operation |
| US5796735A (en) * | 1995-08-28 | 1998-08-18 | Integrated Device Technology, Inc. | System and method for transmission rate control in a segmentation and reassembly (SAR) circuit under ATM protocol |
| US5917828A (en) * | 1997-01-03 | 1999-06-29 | Ncr Corporation | ATM reassembly controller and method |
| US5956344A (en) * | 1997-02-03 | 1999-09-21 | Siemens Information And Communication Networks, Inc. | Interprocessor communications in an ATM environment |
| US5982748A (en) * | 1996-10-03 | 1999-11-09 | Nortel Networks Corporation | Method and apparatus for controlling admission of connection requests |
| US5987031A (en) * | 1997-05-22 | 1999-11-16 | Integrated Device Technology, Inc. | Method for fair dynamic scheduling of available bandwidth rate (ABR) service under asynchronous transfer mode (ATM) |
| US6058114A (en) * | 1996-05-20 | 2000-05-02 | Cisco Systems, Inc. | Unified network cell scheduler and flow controller |
| US6137779A (en) | 1997-05-22 | 2000-10-24 | Integrated Device Technology, Inc. | Transmission rate calculation scheme using table-lookup |
Family Cites Families (3)
| Publication number | Priority date | Publication date | Assignee | Title |
|---|---|---|---|---|
| US5268900A (en) * | 1991-07-05 | 1993-12-07 | Codex Corporation | Device and method for implementing queueing disciplines at high speeds |
| EP0702472A1 (en) * | 1994-09-19 | 1996-03-20 | International Business Machines Corporation | A method and an apparatus for shaping the output traffic in a fixed length cell switching network node |
| US5649110A (en) * | 1994-11-07 | 1997-07-15 | Ben-Nun; Michael | Traffic shaping system with virtual circuit table time stamps for asynchronous transfer mode networks |
-
1999
- 1999-09-28 US US09/406,965 patent/US6285657B1/en not_active Expired - Lifetime
-
2000
- 2000-09-19 WO PCT/US2000/025594 patent/WO2001024423A1/en not_active Application Discontinuation
- 2000-09-19 EP EP00965126A patent/EP1216529A4/en not_active Ceased
Patent Citations (10)
| Publication number | Priority date | Publication date | Assignee | Title |
|---|---|---|---|---|
| US5392280A (en) * | 1994-04-07 | 1995-02-21 | Mitsubishi Electric Research Laboratories, Inc. | Data transmission system and scheduling protocol for connection-oriented packet or cell switching networks |
| US5745694A (en) * | 1994-08-30 | 1998-04-28 | Nec Corporation | Network resource reservation with admission and link control functions separated for expandability and high-speed operation |
| US5796735A (en) * | 1995-08-28 | 1998-08-18 | Integrated Device Technology, Inc. | System and method for transmission rate control in a segmentation and reassembly (SAR) circuit under ATM protocol |
| US6058114A (en) * | 1996-05-20 | 2000-05-02 | Cisco Systems, Inc. | Unified network cell scheduler and flow controller |
| US5742765A (en) * | 1996-06-19 | 1998-04-21 | Pmc-Sierra, Inc. | Combination local ATM segmentation and reassembly and physical layer device |
| US5982748A (en) * | 1996-10-03 | 1999-11-09 | Nortel Networks Corporation | Method and apparatus for controlling admission of connection requests |
| US5917828A (en) * | 1997-01-03 | 1999-06-29 | Ncr Corporation | ATM reassembly controller and method |
| US5956344A (en) * | 1997-02-03 | 1999-09-21 | Siemens Information And Communication Networks, Inc. | Interprocessor communications in an ATM environment |
| US5987031A (en) * | 1997-05-22 | 1999-11-16 | Integrated Device Technology, Inc. | Method for fair dynamic scheduling of available bandwidth rate (ABR) service under asynchronous transfer mode (ATM) |
| US6137779A (en) | 1997-05-22 | 2000-10-24 | Integrated Device Technology, Inc. | Transmission rate calculation scheme using table-lookup |
Non-Patent Citations (16)
| Title |
|---|
| (BW) (Rockwell-Semiconductor)(ROK) Rockwell Semiconductor Systems Unveils ATM and HDSL Chip Solutions at Networld+Interop, Business Editors and High-Tech Writers, Networld+Interop98, May 4, 1998. |
| ATM Chips and Products, Mika Lepisto, Jan. 25, 1995. |
| ATM Congestion Control, Fang Lu, Aug. 21, 1995. |
| ATM in Europe: The User Handbook, European Market Awareness Committee, Jul. 1997. |
| ATM: Practical Implementations Here and Now, 3Com Corporation, (C)1996. |
| ATM: Practical Implementations Here and Now, 3Com Corporation, ©1996. |
| Bt8230 ATM Segmentation and Reassembly Controller-SAR, Rockwell Semiconductor Systems, Inc., (C)1998. |
| Bt8230 ATM Segmentation and Reassembly Controller-SAR, Rockwell Semiconductor Systems, Inc., ©1998. |
| Customer-Premises ATM NTUs, RAD Communications Ltd.; (C)1999. |
| Customer-Premises ATM NTUs, RAD Communications Ltd.; ©1999. |
| Rockwell's Network Access Division Upgrades ATM SAR Controller Chip, Reports Success of Traffic-Management Architecture, Conexant Systems, Inc., (C)1998. |
| Rockwell's Network Access Division Upgrades ATM SAR Controller Chip, Reports Success of Traffic-Management Architecture, Conexant Systems, Inc., ©1998. |
| RS8228: Octal ATM Transmission Convergence PHY Device, Conexant Systems, Inc., (C)1998. |
| RS8228: Octal ATM Transmission Convergence PHY Device, Conexant Systems, Inc., ©1998. |
| RS8235 Endstation ATM xBR Service Segmentation and Reassembly Controller, Conexant Systems, Inc., (C)1998. |
| RS8235 Endstation ATM xBR Service Segmentation and Reassembly Controller, Conexant Systems, Inc., ©1998. |
Cited By (12)
| Publication number | Priority date | Publication date | Assignee | Title |
|---|---|---|---|---|
| US6973047B1 (en) * | 1998-11-10 | 2005-12-06 | At&T Corp. | System and method for providing dynamic bandwidth on demand |
| US20100020694A1 (en) * | 1998-11-10 | 2010-01-28 | Jones Michael B | System and method for providing dynamic bandwidth on demand |
| US7672309B1 (en) * | 1998-11-10 | 2010-03-02 | At&T Intellectual Property Ii, L.P. | System and method for providing dynamic bandwidth on demand |
| US8040894B2 (en) * | 1998-11-10 | 2011-10-18 | At&T Intellectual Property Ii, L.P. | System and method for providing dynamic bandwidth on demand |
| US6449252B1 (en) * | 1999-06-18 | 2002-09-10 | Cisco Technology, Inc. | ATM path cell scheduling for constant and variable bit rate traffic |
| US7114000B1 (en) * | 1999-11-29 | 2006-09-26 | Cisco Technology, Inc. | Scheduling network traffic using multiple logical schedule tables |
| WO2002017552A1 (en) * | 2000-08-24 | 2002-02-28 | Ocular Networks | Apparatus and method for facilitating data packet transportation |
| US7349406B1 (en) * | 2001-10-18 | 2008-03-25 | Network Equipment Technologies Inc. | Method and apparatus for virtual network connection merging |
| US20030142692A1 (en) * | 2002-01-31 | 2003-07-31 | Nagao Shimada | Network side transmission apparatus and method for controlling variable traffic rate by dynamic bandwidth allocation |
| US7508759B2 (en) * | 2002-01-31 | 2009-03-24 | Fujitsu Limited | Network side transmission apparatus and method for controlling variable traffic rate by dynamic bandwidth allocation |
| US20040125809A1 (en) * | 2002-12-31 | 2004-07-01 | Jeng Jack Ing | Ethernet interface over ATM Cell, UTOPIA xDSL in single and multiple channels converter/bridge on a single chip and method of operation |
| CN100442764C (en) * | 2005-06-06 | 2008-12-10 | 华为技术有限公司 | Controlling method for SAR treatment chip transmitting congestion |
Also Published As
| Publication number | Publication date |
|---|---|
| EP1216529A4 (en) | 2003-05-14 |
| WO2001024423A1 (en) | 2001-04-05 |
| EP1216529A1 (en) | 2002-06-26 |
| WO2001024423A9 (en) | 2002-10-03 |
Similar Documents
| Publication | Publication Date | Title |
|---|---|---|
| US6519595B1 (en) | Admission control, queue management, and shaping/scheduling for flows | |
| Garrett | A service architecture for ATM: From applications to scheduling | |
| US6038217A (en) | Rate shaping in per-flow output queued routing mechanisms for available bit rate (ABR) service in networks having segmented ABR control loops | |
| US6377583B1 (en) | Rate shaping in per-flow output queued routing mechanisms for unspecified bit rate service | |
| US5726985A (en) | ATM communication system interconnect/termination unit | |
| US5926459A (en) | Rate shaping in per-flow queued routing mechanisms for available bit rate service | |
| EP0817436B1 (en) | Packet switched communication system | |
| US6501731B1 (en) | CBR/VBR traffic scheduler | |
| US5909443A (en) | ATM network congestion control system using explicit rate cell marking | |
| US5999518A (en) | Distributed telecommunications switching system and method | |
| US6064650A (en) | Rate shaping in per-flow output queued routing mechanisms having output links servicing multiple physical layers | |
| US6466997B1 (en) | Method and apparatus for performing TX raw cell status report frequency and interrupt frequency mitigation in a network node | |
| US5848068A (en) | ATM communication system interconnect/termination unit | |
| WO2000001120A9 (en) | Cbr/vbr traffic scheduler | |
| EP0702472A1 (en) | A method and an apparatus for shaping the output traffic in a fixed length cell switching network node | |
| US6535512B1 (en) | ATM communication system interconnect/termination unit | |
| US6292491B1 (en) | Distributed FIFO queuing for ATM systems | |
| US5841772A (en) | ATM communication system interconnect/termination unit | |
| Houh et al. | The vunet desk area network: Architecture, implementation, and experience | |
| Alfaro et al. | QoS in InfiniBand subnetworks | |
| EP0817433B1 (en) | Packet switched communication system and traffic shaping process | |
| US6285657B1 (en) | System and method of scheduling data cells based upon sustainable cell rate and peak cell rate over a variable bandwidth channel | |
| US20020150047A1 (en) | System and method for scheduling transmission of asynchronous transfer mode cells | |
| US6359862B1 (en) | ATM network available bit rate (ABR) explicit rate flow control system | |
| Cisco | ATM Commands |
Legal Events
| Date | Code | Title | Description |
|---|---|---|---|
| AS | Assignment |
Owner name: CONEXANT SYSTEMS, INC, CALIFORNIA Free format text: ASSIGNMENT OF ASSIGNORS INTEREST;ASSIGNORS:LEWIS, RONALD C.;MAHLER, HENRY H.;REEL/FRAME:010298/0293 Effective date: 19990916 |
|
| STCF | Information on status: patent grant |
Free format text: PATENTED CASE |
|
| FEPP | Fee payment procedure |
Free format text: PAYOR NUMBER ASSIGNED (ORIGINAL EVENT CODE: ASPN); ENTITY STATUS OF PATENT OWNER: LARGE ENTITY |
|
| AS | Assignment |
Owner name: MINDSPEED TECHNOLOGIES, CALIFORNIA Free format text: ASSIGNMENT OF ASSIGNORS INTEREST;ASSIGNOR:CONEXANT SYSTEMS, INC.;REEL/FRAME:014468/0137 Effective date: 20030627 |
|
| AS | Assignment |
Owner name: CONEXANT SYSTEMS, INC., CALIFORNIA Free format text: SECURITY AGREEMENT;ASSIGNOR:MINDSPEED TECHNOLOGIES, INC.;REEL/FRAME:014546/0305 Effective date: 20030930 |
|
| FPAY | Fee payment |
Year of fee payment: 4 |
|
| FPAY | Fee payment |
Year of fee payment: 8 |
|
| FPAY | Fee payment |
Year of fee payment: 12 |
|
| AS | Assignment |
Owner name: MINDSPEED TECHNOLOGIES, INC, CALIFORNIA Free format text: RELEASE OF SECURITY INTEREST;ASSIGNOR:CONEXANT SYSTEMS, INC;REEL/FRAME:031494/0937 Effective date: 20041208 |
|
| AS | Assignment |
Owner name: JPMORGAN CHASE BANK, N.A., AS ADMINISTRATIVE AGENT Free format text: SECURITY INTEREST;ASSIGNOR:MINDSPEED TECHNOLOGIES, INC.;REEL/FRAME:032495/0177 Effective date: 20140318 |
|
| AS | Assignment |
Owner name: MINDSPEED TECHNOLOGIES, INC., CALIFORNIA Free format text: RELEASE BY SECURED PARTY;ASSIGNOR:JPMORGAN CHASE BANK, N.A.;REEL/FRAME:032861/0617 Effective date: 20140508 Owner name: GOLDMAN SACHS BANK USA, NEW YORK Free format text: SECURITY INTEREST;ASSIGNORS:M/A-COM TECHNOLOGY SOLUTIONS HOLDINGS, INC.;MINDSPEED TECHNOLOGIES, INC.;BROOKTREE CORPORATION;REEL/FRAME:032859/0374 Effective date: 20140508 |
|
| AS | Assignment |
Owner name: MINDSPEED TECHNOLOGIES, LLC, MASSACHUSETTS Free format text: CHANGE OF NAME;ASSIGNOR:MINDSPEED TECHNOLOGIES, INC.;REEL/FRAME:039645/0264 Effective date: 20160725 |
|
| AS | Assignment |
Owner name: MACOM TECHNOLOGY SOLUTIONS HOLDINGS, INC., MASSACH Free format text: ASSIGNMENT OF ASSIGNORS INTEREST;ASSIGNOR:MINDSPEED TECHNOLOGIES, LLC;REEL/FRAME:044791/0600 Effective date: 20171017 |