US20030195961A1 - End to end component mapping and problem - solving in a network environment - Google Patents
End to end component mapping and problem - solving in a network environment Download PDFInfo
- Publication number
- US20030195961A1 US20030195961A1 US10/122,001 US12200102A US2003195961A1 US 20030195961 A1 US20030195961 A1 US 20030195961A1 US 12200102 A US12200102 A US 12200102A US 2003195961 A1 US2003195961 A1 US 2003195961A1
- Authority
- US
- United States
- Prior art keywords
- component
- parameters
- events
- probe
- event
- Prior art date
- Legal status (The legal status is an assumption and is not a legal conclusion. Google has not performed a legal analysis and makes no representation as to the accuracy of the status listed.)
- Granted
Links
Images


Classifications
-
- H—ELECTRICITY
- H04—ELECTRIC COMMUNICATION TECHNIQUE
- H04L—TRANSMISSION OF DIGITAL INFORMATION, e.g. TELEGRAPHIC COMMUNICATION
- H04L41/00—Arrangements for maintenance, administration or management of data switching networks, e.g. of packet switching networks
- H04L41/06—Management of faults, events, alarms or notifications
- H04L41/0631—Management of faults, events, alarms or notifications using root cause analysis; using analysis of correlation between notifications, alarms or events based on decision criteria, e.g. hierarchy, tree or time analysis
-
- H—ELECTRICITY
- H04—ELECTRIC COMMUNICATION TECHNIQUE
- H04L—TRANSMISSION OF DIGITAL INFORMATION, e.g. TELEGRAPHIC COMMUNICATION
- H04L43/00—Arrangements for monitoring or testing data switching networks
- H04L43/08—Monitoring or testing based on specific metrics, e.g. QoS, energy consumption or environmental parameters
- H04L43/091—Measuring contribution of individual network components to actual service level
-
- H—ELECTRICITY
- H04—ELECTRIC COMMUNICATION TECHNIQUE
- H04L—TRANSMISSION OF DIGITAL INFORMATION, e.g. TELEGRAPHIC COMMUNICATION
- H04L43/00—Arrangements for monitoring or testing data switching networks
- H04L43/12—Network monitoring probes
-
- H—ELECTRICITY
- H04—ELECTRIC COMMUNICATION TECHNIQUE
- H04L—TRANSMISSION OF DIGITAL INFORMATION, e.g. TELEGRAPHIC COMMUNICATION
- H04L41/00—Arrangements for maintenance, administration or management of data switching networks, e.g. of packet switching networks
- H04L41/50—Network service management, e.g. ensuring proper service fulfilment according to agreements
- H04L41/5003—Managing SLA; Interaction between SLA and QoS
- H04L41/5019—Ensuring fulfilment of SLA
- H04L41/5025—Ensuring fulfilment of SLA by proactively reacting to service quality change, e.g. by reconfiguration after service quality degradation or upgrade
-
- H—ELECTRICITY
- H04—ELECTRIC COMMUNICATION TECHNIQUE
- H04L—TRANSMISSION OF DIGITAL INFORMATION, e.g. TELEGRAPHIC COMMUNICATION
- H04L41/00—Arrangements for maintenance, administration or management of data switching networks, e.g. of packet switching networks
- H04L41/50—Network service management, e.g. ensuring proper service fulfilment according to agreements
- H04L41/5029—Service quality level-based billing, e.g. dependent on measured service level customer is charged more or less
-
- H—ELECTRICITY
- H04—ELECTRIC COMMUNICATION TECHNIQUE
- H04L—TRANSMISSION OF DIGITAL INFORMATION, e.g. TELEGRAPHIC COMMUNICATION
- H04L43/00—Arrangements for monitoring or testing data switching networks
- H04L43/16—Threshold monitoring
-
- H—ELECTRICITY
- H04—ELECTRIC COMMUNICATION TECHNIQUE
- H04L—TRANSMISSION OF DIGITAL INFORMATION, e.g. TELEGRAPHIC COMMUNICATION
- H04L43/00—Arrangements for monitoring or testing data switching networks
- H04L43/50—Testing arrangements
- H04L43/55—Testing of service level quality, e.g. simulating service usage
Definitions
- the present invention relates generally to information handling, and more particularly to end to end component mapping and problem
- a wide variety of valuable services are provided through client-server applications, so proper performance of these applications may be very important.
- lack of useful information can hamper efforts to restore the proper performance of a client-server application.
- These applications may involve many hardware and software components in a network environment, so it may be difficult to quickly identify a component that is causing a problem.
- systems and methods that provide information to properly focus problem—solving efforts for client-server applications, including but not limited to web sites and web services.
- An example of a solution to problems mentioned above comprises providing input from probes, with the input including events generated by an application probe, and events generated by a component probe, and correlating the events.
- This example solution may further comprise identifying a component problem that is a cause of a performance problem affecting a user of a client—server application.
- Another example of the solutions provided comprises representing components and events with structured identifiers, each having a limited number of parameters.
- This example solution may further comprise employing the identifiers to do one or more tasks such as inputting data, storing data, outputting data and relating an event to a corrective action.
- FIG. 1 illustrates a simplified example of an information handling system that may be used to practice the present invention.
- FIG. 2 is a block diagram illustrating one example of how the present invention was implemented in a data center that hosted a web site.
- FIG. 3 is a diagram showing an example of identifying a problem with one or more components, according to the present invention.
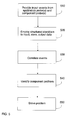
- FIG. 4 is a flow chart illustrating one example of how end to end component mapping and problem solving may be implemented in an information technology consulting or design context.
- FIG. 5 is a flow chart illustrating one example of how end to end component mapping and problem solving may be implemented in an operations context.
- Availability means ability to be accessed or used.
- Business process means any process involving use of a computer by any enterprise, group, or organization; the process may involve providing goods or services of any kind.
- Client-server application means any application involving a client that utilizes a service, and a server that provides a service. Examples of such a service include but are not limited to: information services, transactional services, access to databases, and access to audio or video content.
- “Comparing” means bringing together for the purpose of finding any likeness or difference, including a quantitative likeness or difference. “Comparing” may involve answering questions including but not limited to: “Is a measured response time greater than a threshold response time?” Or “Is a response time measured by a remote probe significantly greater than a response time measured by a local probe?”
- Component means any element or part, and may include elements consisting of hardware or software or both.
- Computer-usable medium means any carrier wave, signal or transmission facility for communication with computers, and any kind of computer memory, such as floppy disks, hard disks, Random Access Memory (RAM), Read Only Memory (ROM), CD-ROM, flash ROM, non-volatile ROM, and non-volatile memory.
- RAM Random Access Memory
- ROM Read Only Memory
- CD-ROM Compact Disc-read Only Memory
- flash ROM non-volatile ROM
- non-volatile memory non-volatile memory
- Measureing means evaluating or quantifying.
- Event means any action initiated by a computer or a user, including the sending of alerts, warnings, or other signals.
- Outputting means producing, transmitting, or turning out in some manner, including but not limited to printing on paper, or displaying on a screen, or using an audio device.
- Performance means execution or doing; “performance” may refer to any aspect of an application's operation, including availability, response time, time to complete batch processing or other aspects.
- Probe means any computer used in evaluating, investigating, or quantifying the functioning of a component or the performance of an application; for example a “probe” may be a personal computer executing a script, acting as a client, and requesting services from a server.
- Response time means elapsed time in responding to a request or signal.
- Script means any program used in evaluating, investigating, or quantifying performance; for example a script may cause a computer to send requests or signals according to a transaction scenario.
- a script may be written in a scripting language such as Perl or some other programming language.
- Service level agreement means any oral or written agreement between provider and user.
- service level agreement includes but is not limited to an agreement between vendor and customer, and an agreement between an information technology department and an end user.
- a “service level agreement” might involve one or more client—server applications, and might include specifications regarding availability, response times or problem—solving.
- “Storing” data or information, using a computer means placing the data or information, for any length of time, in any kind of computer memory, such as floppy disks, hard disks, Random Access Memory (RAM), Read Only Memory (ROM), CD-ROM, flash ROM, non-volatile ROM, and non-volatile memory.
- RAM Random Access Memory
- ROM Read Only Memory
- CD-ROM Compact Disc-ROM
- flash ROM non-volatile ROM
- non-volatile memory any kind of computer memory
- “Structured identifier” means any definition, label, tag, or other means of identifying something, with a certain arrangement or order.
- Threshold value means any value used as a borderline, standard, or target; for example, a “threshold value” may be derived from a service level agreement, industry norms, or other sources.
- FIG. 1 illustrates a simplified example of an information handling system that may be used to practice the present invention.
- the invention may be implemented on a variety of hardware platforms, including embedded systems, personal computers, workstations, servers, and mainframes.
- the computer system of FIG. 1 has at least one processor 110 .
- Processor 110 is interconnected via system bus 112 to random access memory (RAM) 116 , read only memory (ROM) 114 , and input/output (I/O) adapter 118 for connecting peripheral devices such as disk unit 120 and tape drive 140 to bus 112 .
- RAM random access memory
- ROM read only memory
- I/O input/output
- the system has user interface adapter 122 for connecting keyboard 124 , mouse 126 , or other user interface devices such as audio output device 166 and audio input device 168 to bus 112 .
- the system has communication adapter 134 for connecting the information handling system to a data processing network 150 , and display adapter 136 for connecting bus 112 to display device 138 .
- Communication adapter 134 may link the system depicted in FIG. 1 with hundreds or even thousands of similar systems, or other devices, such as remote printers, remote servers, or remote storage units.
- the system depicted in FIG. 1 may be linked to both local area networks (sometimes referred to as Intranets) and wide area networks, such as the Internet.
- FIG. 1 While the computer system described in FIG. 1 is capable of executing the processes described herein, this computer system is simply one example of a computer system. Those skilled in the art will appreciate that many other computer system designs are capable of performing the processes described herein.
- FIG. 2 is a block diagram illustrating one example of how the present invention was implemented in a data center that hosted a web site.
- FIG. 2 shows a simplified example of a typical e-business infrastructure, including a variety of network, server, and middleware components. These components are symbolized by server 270 , server 280 , and the boxes visible behind server 270 and server 280 .
- this example comprised: providing input from a plurality of probes, including events (symbolized by arrows pointing to console 205 ) generated by at least one application probe (shown at 221 ) and at least one component probe (shown at 271 ); and correlating the events.
- FIG. 2 shows application probe 221 and component probe 271 providing input (symbolized by arrows) to console 205 , which was used in correlating the events.
- application probes such as probe 221 measured response time for requests.
- the double-headed arrow connecting local application probe 221 with application 201 symbolizes requests and responses.
- Local application probe 221 was implemented with a personal computer, utilizing IBM's Enterprise Probe Platform technology, but other kinds of hardware and software could be used.
- a local application probe 221 was placed on the IBM network just outside the firewall at the center where the web site was hosted.
- a local application probe 221 was used to probe one specific site per probe. There could be multiple scripts per site.
- a local application probe 221 executed the script every 20 minutes. Intervals of other lengths also could be used.
- Component probe 271 could be implemented with a personal computer running a script, but other kinds of hardware and software could be used.
- Component probe 271 could be implemented with software products (such as those available from TIVOLI, for example, or other similar products). These products provide a framework for probing infrastructure components. These products are available for various operating systems and middle ware components.
- FIG. 2 Another aspect of this example in FIG. 2 was providing an alert (i.e. an event signaling a problem) when probe 221 or probe 271 detected an error.
- An example of an error in application 201 would be a measured response time value greater than a corresponding threshold value.
- a local application probe 221 encountered a problem (e.g. it was unable to access the site or unable to complete the script) on two consecutive executions of the script, local application probe 221 generated a real time alert (problem event, symbolized by arrow pointing to console 205 ), and sent it to a TIVOLI management system (shown as console 205 ).
- TIVOLI management system shown as console 205
- Another similar kind of management system could be used.
- an alert was provided via a system management computer.
- An alert message via email also could be used.
- component probe 271 generated a problem event (symbolized by arrow pointing to console 205 ) when a component problem was detected.
- LCPs Local component probes
- LCPs may be deployed locally in hosting sites, service delivery centers or data centers (e.g. at 211 ).
- Network Probes measure network infrastructure response time and availability.
- Remote Network Probes may be deployed in a local hosting site or data center (e.g. at 211 ) if measuring the intranet or at Internet Service Provider (ISP) sites if measuring the Internet.
- ISP Internet Service Provider
- Application Probes measure availability and performance of applications and business processes.
- LAP Local Application Probe
- Remote Application Probe An application probe deployed from a remote location is termed a Remote Application Probe.
- probe is a logical one. Thus for example, implementing a local component probe could actually consist of implementing multiple physical probes.
- Providing a script for an application probe would comprise defining a set of transactions that are frequently performed by end users.
- Employing a plurality of application probes would comprise placing at least one remote application probe (not shown in FIG. 2) at each location having a relatively large population of end users.
- the Remote Application Probe transactions and Local Application Probe transactions should be the same transactions.
- the example measured all the transactions locally (shown at 221 ), so that the local application response time can be compared to the remote application response time. This can provide insight regarding application performance issues. End-to-end measurement of an organization's internal applications for internal customers will involve a RAP on an intranet, whereas end-to-end measurement of an organization's external applications for customers, business partners, suppliers, etc.
- Application 201 may be any client-server application. Some examples are a web site, a web application, database management software, a customer relationship management system, an enterprise resource planning system, or an opportunity—management business process where a client directly connects to a server.
- the example in FIG. 2 comprised providing an alert when an error occurred.
- the alert may be provided via email, for example, or may be provided in real time via a network and a system management computer 205 .
- a clearing message may be provided when the error no longer is detected.
- local application probe 221 generated a real time alert (problem event), and sent it to a TIVOLI management system (shown as console 205 ).
- TIVOLI management system shown as console 205 .
- Another similar kind of management system could be used.
- the local application probe 221 automatically sent events to the management console 205 used by the operations department.
- integration was provided with the TIVOLI MANAGEMENT ENVIRONMENT and the TIVOLI EVENT CONSOLE product.
- the example solution generated events from the local application probe 221 , and the events were generated after two consecutive errors on the same step in the business process. This could then be adjusted to send an event on the first error, for even faster notification.
- the recommendation is to send events on the second occurrence initially and then adjust to sending the event on the first occurrence as the environment becomes more stable and better understood by the operational staff. The reason for the recommendation is that in a Web environment there are a number of things that can cause intermittent problems, and it is ultimately a business decision when to invoke problem determination procedures.
- tag:auth crtGwaFw
- tag:message PartnerCommerceNA https://ecna.partner.com Step-NAQS2-failed: Logon failed.
- tag:slot hostname d03bpec18.pinfo.com
- tag:class crt_event
- tag:auth crtGwaFw
- tag:message PartnerCommerceNA https://ecna.partner.com Step-NAQS2-failed: The problem causing the previous alert has been fixed.
- tag:slot hostname d03 bpec18.pinfo.com
- tag:slot mail svr CVRM
- tag:class crt_event
- tag:source SENTRY
- FIG. 3 is a diagram showing an example of identifying a problem with one or more components, according to the present invention.
- FIG. 3 illustrates how operational staff may establish relationships among a component problem 301 , events 321 and 371 generated by probes, and performance problem 391 that affects a customer or other end user. Methods and systems are provided herein for assisting operational staff in reducing mean time to repair a component problem 301 , and thus solve a performance problem 391 , for example.
- a component problem 301 is a root cause of a performance problem 391 , that affects a user of a client—server application.
- Component problem 301 is associated with events generated by probes: event 321 , generated by an application probe, and event 371 , generated by a component probe.
- Event 321 signals a performance problem with an application.
- event 321 might be similar to the problem event described above regarding FIG. 2, where a probe was unable to log on to a web site; or event 321 might be generated when a “time out” problem is encountered at some transaction step.
- event 371 might alert operational staff that a disk failure has occurred on a server. In that case, component problem 301 would be a disk failure. Methods and systems are provided herein for correlating events such as event 321 and event 371 .
- the example in FIG. 3 may involve component problem 301 causing a performance problem 391 , that affects a customer of a business.
- the example in FIG. 3 may involve identifying component problem 301 's impact on a business process that employs the component.
- performance problem 391 might be a response time that becomes too long to be acceptable for a customer. Such a situation might deserve intervention by operational staff before a complete failure occurs, depending on the importance of a business process that employs the component.
- the example in FIG. 3 may involve directing problem—solving efforts, or identifying an opportunity to improve the performance of a client—server application, whether or not a complete failure occurs.
- FIG. 4 is a flow chart illustrating one example of how end to end component mapping and problem solving may be implemented in an information technology consulting or design context.
- This example begins with identifying transaction steps, at block 410 .
- These transaction steps could be any steps that involve a client-server application. Some examples are steps involved in using a web site, a web application, web services, database management software, a customer relationship management system, an enterprise resource planning system, or an opportunity—management business process.
- the output from identifying transaction steps, at block 410 may be a table containing the transaction step number, step name, and a description of what action the end user takes to execute the step. Table 1 below is an example of such a table, based on a web site for selling computer hardware. TABLE 1 Step No.
- NAQS1 Open URL Go to URL http:// NAQS2 Logon Enter Login ID/Password. Click on Logon button.
- NAQS3 Navigation 1 Click on Personal Systems and NETFINITY NAQS4 Clear Form Select ‘Clear the form’. Click “ok” on pop-up window.
- NAQS5 Select Catalog Select Catalog Order from left hand navigation bar
- NAQS6 Select Printers Select Printers
- NAQS7 Select Printer Model Select Infoprint
- NAQS8 Add to Order Type 1 in Quantity box for 1st item Click Add to Order, Click OK on pop-up window
- NAQS9 Display Order Form Click on Go to order form
- NAQS10 Validate Order Click Save/Validate Items
- Another possible output from identifying transaction steps, at block 410 may be a script to run on a local application probe or remote application probe.
- identifying components associated with the transaction steps may involve identifying application components and identifying infrastructure components.
- a variety of network, server, and middle ware components may be identified. This may include resources indirectly involved with transaction steps, such as a link to a back-end system providing data to web site. This link might only be used during the night to push new content to a web site. If the link becomes unavailable, the web site will contain incorrect data. This might cause customer dissatisfaction or loss of revenue.
- a possible output from identifying components, at block 420 may be a table containing the transaction step name, the name of an application supporting the step, and the data center where the application is hosted. Table 2 below is an example of such a table. TABLE 2 Supporting Data Step name Application center Open URL Application 1 Boulder Logon Application 2 Southbury Navigation 1 Application 1 Boulder Clear Form Application 1 Boulder Select Catalog Application 1 Boulder Select Printers Application 1 Boulder Select Printer Model Application 1 Boulder Add to Order Application 1 Boulder Display Order Form Application 1 Boulder Validate Order Application 3 Portsmouth Home Page Application 1 Boulder Logoff Application 1 Boulder
- Another example of possible output from identifying components, at block 420 may be a table such as Table 3 below. It identifies infrastructure components that support the individual applications. TABLE 3 Infrastructure Middleware Network Application dependencies dependencies dependencies Application 1 d0xx2111, MQSeries Link 9 d0xx2113, Channel A d0xx2115 Application 2 d0xx2112 MQSeries Link 9, Channel B Link 12 Application 3 d0xx2119 DB/2 database Link 15 Customer data
- Block 430 providing input associated with the transaction steps, from a plurality of probes.
- the input would include at least one event generated by an application probe, and at least one event generated by a component probe.
- Providing input may further comprise determining specifications to support the deployment of the probes.
- Determining specifications may further comprise determining a plurality of specifications such as: a resource specification; a threshold value specification; an event severity specification; and an event class specification.
- a resource specification would define an infrastructure resource to be probed, such as file space used on a server.
- a threshold value specification might be “file space 80% full,” for example. Examples of event severity specifications “warning” and “harmless” were given above in connection with FIG. 2.
- an infrastructure support team might address storage—related problems, and that team's console would be configured to receive the “sentry” class of events, for example.
- Various kinds of hardware and software resources would require various kinds of specifications to support the deployment of the probes.
- FIG. 4 Next in this example in FIG. 4 is block 440 , correlating events. For example, one may confirm a relationship between an event generated by an application probe, and an event generated by a component probe, as described above in connection with FIG. 3.
- a tool to help in correlating events is representing each of the components and each of the events with a structured identifier, where each of the identifiers has a limited number of parameters.
- the parameters typically would include depth, component name, parent component, business process name, and criticality. Other parameters could be used as well.
- the depth parameter for example, one implementation used a hierarchy with a limited number of levels, where Level 0 was the highest level of a business process. Level 6, the lowest level, contained events generated by component probes (e.g.
- CRM2000 customer relationship management
- Each line in Table 4 contains the same business process name, “CRM2000.” This allows correlating events, and allows identifying a component problem's impact on a business process that employs the component.
- Table 4 shows an example using five parameters (depth, name, parent component, business process name, and criticality) to give a logical view of a business process, its components and events.
- This example used levels numbered from 0 to 6.
- Level 0 was the highest level of a business process, CRM2000.
- Level 1 contained components (subprocesses) of CRM2000: “Marketing” and “Sales.”
- Level 2 contained a subprocess of Sales: a “Lead Opportunity Management” application, with a user interface utilized by end users.
- Level 3 contained transaction steps, and events generated by application probes.
- Level 4 contained logical components in the infrastructure, such as IBM's Global Web Architecture (GWA), an environment that hosts web servers.
- Level 5 contained infrastructure components such as servers.
- Level 6, the lowest level, contained events generated by component probes.
- Component “d0xx” was a server. “Timeout” was an event generated by an application probe; “Inetd” and “Disk failure” were events generated by component probes.
- the event “Inetd” indicated a problem with a software component (inetd, the Internet super—server daemon, in an operating system such as UNIX, LINUX, or IBM's AIX).
- the event “Disk failure” indicated a problem with a hardware component (a disk).
- a structured identifier may be expressed in plain text, following this pattern, for example: (Depth, Component Name, Parent Component, Business Process Name, Criticality).
- a software component “inetd” could have the following identifier: (6, inetd, d0xx1, CRM2000, Critical). This identifier identifies the position of each component, and retains the data pertaining to its relationships and dependencies.
- the same software component “inetd,” regarding its utilization in another application or business process called “CVRM,” could have the following identifier: (6, inetd, d0xx1, CVRM, Critical).
- an additional parameter for problem determination can be added.
- the purpose of this parameter would be to associate problem determination procedures to every event generated.
- This parameter could be used to identify the actions or procedures to be used when this event is generated. These actions or procedures can be automatic (e.g. identifying a program or function to be automatically executed when the event occurs).
- Another implementation could be to use this parameter as an index into an operational repository to retrieve written instructions to be followed to correct the problem. Depending on the missions of different organizations, the operational procedures will vary.
- the automated PD process could be to run the appropriate shell script to restart the inetd daemon.
- the operational procedure could be a reference to a document describing how to replace broken hardware and apply the necessary backup and restore procedures.
- the PD parameter could refer to an automated or written process for how the business owner of the process is contacted and informed about the business impact of the infrastructure problem.
- a second example would be to add a destination parameter to the event.
- an eBusiness Center could have a mission to manage the end to end process from a customer perspective and the service delivery centers could perform traditional information technology services.
- the destination (i.e. a target audience or event console) parameter could be used to indicate that the event documenting the disk crash has been sent to an event console used by the service delivery center with a responsibility to address infrastructure problems.
- the service delivery center may receive the disk crash event as CRITICAL.
- the same event could be sent to different destinations with different values in the criticality parameter, depending on the roles and responsibilities of the target audience.
- the disk crash event could be sent to the eBusiness Command Center and could have a criticality value of WARNING.
- SLA's Service Level Agreements
- SLA's Service Level Agreements
- these SLA's differ based on the missions of the organizations, so the end to end SLA documents the availability agreement for the customer process, and the SLA for infrastructure documents hardware availability etc. Since these SLA's are commitments by the service providers and could impose penalties, it is useful to direct problem resolution activities in accordance with the service level commitments. More sophisticated implementations could include automatic data collection for SLA attainment calculations.
- block 450 directing problem—solving efforts. Some examples of this were given above, regarding parameters and structured identifiers.
- block 460 improving performance; typically this would involve identifying an opportunity to improve the performance of one or more client—server applications. For example, performance degradation caused by specific components could be ascertained, and proactive measures could be taken to improve performance.
- FIG. 5 is a flow chart illustrating one example of how end to end component mapping and problem solving may be implemented in an operations context.
- This example begins at block 510 , with providing input from a plurality of probes. Typically the input would include at least one event generated by an application probe, and at least one event generated by a component probe.
- block 520 employing structured identifiers. Typically this would involve representing each of the components and each of the events with a structured identifier, where each of the identifiers has a limited number of parameters, as discussed above regarding Table 4. Structured identifiers may be employed to do one or more tasks such as inputting data, storing data, and outputting data.
- operational staff could use a form similar to Table 4 above for inputting or outputting data.
- a form similar to Table 4 could be printed on paper or displayed on a screen.
- Other examples based on Table 4 would be utilizing a data structure in which each component and each event has a unique five-parameter identifier, or utilizing a programming object that includes a five-parameter identifier. Additional parameters could be used, as discussed above, with corresponding variations in forms or data structures.
- a tool to help in correlating events is the structured identifier that identifies the position of each component and each event, and retains the data pertaining to its relationships and dependencies. For example, one may confirm a relationship between an event generated by an application probe, and an event generated by a component probe, as described above in connection with FIG. 3.
- FIG. 5 Next in this example in FIG. 5 is block 540 , identifying a component problem, followed by block 550 , solving the component problem (and thus solving the performance problem affecting a user of an application).
- Problem—solving examples involving hardware and software failures were given above, regarding parameters and structured identifiers.
- performance degradation caused by specific components could be ascertained, and proactive measures could be taken to improve performance.
- One of the preferred implementations of the invention is an application, namely a set of instructions (program code) in a code module which may, for example, be resident in the random access memory of a computer.
- the set of instructions may be stored in another computer memory, for example, in a hard disk drive, or in a removable memory such as an optical disk (for eventual use in a CD ROM) or floppy disk (for eventual use in a floppy disk drive), or downloaded via the Internet or other computer network.
- the present invention may be implemented as a computer-usable medium having computer-executable instructions for use in a computer.
- the appended claims may contain the introductory phrases at least one or one or more to introduce claim elements.
- the use of such phrases should not be construed to imply that the introduction of a claim element by indefinite articles such as a or an limits any particular claim containing such introduced claim element to inventions containing only one such element, even when the same claim includes the introductory phrases at least one or one or more and indefinite articles such as a or an; the same holds true for the use in the claims of definite articles.
Abstract
Description
- The present application is related to co-pending applications entitled Method and System for Probing in a Network Environment, application Ser. No. 10/062,329, filed on Jan. 31, 2002, Method and System for Performance Reporting in a Network Environment, application Ser. No. 10/062,369, filed on Jan. 31, 2002, and Graphics for End to End Component Mapping and Problem—Solving in a Network Environment, filed on even date herewith. These co-pending applications are assigned to the assignee of the present application, and herein incorporated by reference. A portion of the disclosure of this patent document contains material which is subject to copyright protection. The copyright owner has no objection to the facsimile reproduction by anyone of the patent document or the patent disclosure, as it appears in the Patent and Trademark Office patent file or records, but otherwise reserves all copyright rights whatsoever.
- The present invention relates generally to information handling, and more particularly to end to end component mapping and problem
- solving, for information handling in a network environment.
- Various approaches have been proposed for monitoring, simulating, or testing web sites. Examples include U.S. Pat. No. 6,278,966 B1 (Howard, et al., Aug. 21, 2001), “Method and System for Emulating Web Site Traffic to Identify Web Site Usage Patterns.” However, this example addresses substantially different problems (problems of simulation and hypothetical phenomena), and thus is significantly different from the present invention. Other examples include U.S. Pat. No. 6,078,956 (Bryant, et al., Jun. 20, 2000) and U.S. Pat. No. 5,787,254 (Maddalozzo, et al., Jul. 28, 1998). Other examples include services available from vendors such as Atesto Technologies Inc., Keynote Systems, and Mercury Interactive Corporation. These services may involve a script that runs on a probe computer. The examples mentioned above do not necessarily provide means for directing problem-solving efforts.
- A wide variety of valuable services are provided through client-server applications, so proper performance of these applications may be very important. When a problem occurs, lack of useful information can hamper efforts to restore the proper performance of a client-server application. These applications may involve many hardware and software components in a network environment, so it may be difficult to quickly identify a component that is causing a problem. Thus there is a need for systems and methods that provide information to properly focus problem—solving efforts for client-server applications, including but not limited to web sites and web services.
- An example of a solution to problems mentioned above comprises providing input from probes, with the input including events generated by an application probe, and events generated by a component probe, and correlating the events. This example solution may further comprise identifying a component problem that is a cause of a performance problem affecting a user of a client—server application.
- Another example of the solutions provided comprises representing components and events with structured identifiers, each having a limited number of parameters. This example solution may further comprise employing the identifiers to do one or more tasks such as inputting data, storing data, outputting data and relating an event to a corrective action.
- A better understanding of the present invention can be obtained when the following detailed description is considered in conjunction with the following drawings. The use of the same reference symbols in different drawings indicates similar or identical items.
- FIG. 1 illustrates a simplified example of an information handling system that may be used to practice the present invention.
- FIG. 2 is a block diagram illustrating one example of how the present invention was implemented in a data center that hosted a web site.
- FIG. 3 is a diagram showing an example of identifying a problem with one or more components, according to the present invention.
- FIG. 4 is a flow chart illustrating one example of how end to end component mapping and problem solving may be implemented in an information technology consulting or design context.
- FIG. 5 is a flow chart illustrating one example of how end to end component mapping and problem solving may be implemented in an operations context.
- The examples that follow involve the use of one or more computers and may involve the use of one or more communications networks. The present invention is not limited as to the type of computer on which it runs, and not limited as to the type of network used.
- The following are definitions of terms used in the description of the present invention and in the claims:
- “Availability” means ability to be accessed or used.
- “Business process” means any process involving use of a computer by any enterprise, group, or organization; the process may involve providing goods or services of any kind.
- “Client-server application” means any application involving a client that utilizes a service, and a server that provides a service. Examples of such a service include but are not limited to: information services, transactional services, access to databases, and access to audio or video content.
- “Comparing” means bringing together for the purpose of finding any likeness or difference, including a quantitative likeness or difference. “Comparing” may involve answering questions including but not limited to: “Is a measured response time greater than a threshold response time?” Or “Is a response time measured by a remote probe significantly greater than a response time measured by a local probe?”
- “Component” means any element or part, and may include elements consisting of hardware or software or both.
- “Computer-usable medium” means any carrier wave, signal or transmission facility for communication with computers, and any kind of computer memory, such as floppy disks, hard disks, Random Access Memory (RAM), Read Only Memory (ROM), CD-ROM, flash ROM, non-volatile ROM, and non-volatile memory.
- “Measuring” means evaluating or quantifying.
- “Event” means any action initiated by a computer or a user, including the sending of alerts, warnings, or other signals.
- “Outputting” means producing, transmitting, or turning out in some manner, including but not limited to printing on paper, or displaying on a screen, or using an audio device.
- “Performance” means execution or doing; “performance” may refer to any aspect of an application's operation, including availability, response time, time to complete batch processing or other aspects.
- “Probe” means any computer used in evaluating, investigating, or quantifying the functioning of a component or the performance of an application; for example a “probe” may be a personal computer executing a script, acting as a client, and requesting services from a server.
- “Response time” means elapsed time in responding to a request or signal.
- “Script” means any program used in evaluating, investigating, or quantifying performance; for example a script may cause a computer to send requests or signals according to a transaction scenario. A script may be written in a scripting language such as Perl or some other programming language.
- “Service level agreement” means any oral or written agreement between provider and user. For example, “service level agreement” includes but is not limited to an agreement between vendor and customer, and an agreement between an information technology department and an end user. For example, a “service level agreement” might involve one or more client—server applications, and might include specifications regarding availability, response times or problem—solving.
- “Storing” data or information, using a computer, means placing the data or information, for any length of time, in any kind of computer memory, such as floppy disks, hard disks, Random Access Memory (RAM), Read Only Memory (ROM), CD-ROM, flash ROM, non-volatile ROM, and non-volatile memory.
- “Structured identifier” means any definition, label, tag, or other means of identifying something, with a certain arrangement or order.
- “Threshold value” means any value used as a borderline, standard, or target; for example, a “threshold value” may be derived from a service level agreement, industry norms, or other sources.
- FIG. 1 illustrates a simplified example of an information handling system that may be used to practice the present invention. The invention may be implemented on a variety of hardware platforms, including embedded systems, personal computers, workstations, servers, and mainframes. The computer system of FIG. 1 has at least one
processor 110.Processor 110 is interconnected viasystem bus 112 to random access memory (RAM) 116, read only memory (ROM) 114, and input/output (I/O)adapter 118 for connecting peripheral devices such asdisk unit 120 andtape drive 140 tobus 112. The system hasuser interface adapter 122 for connectingkeyboard 124,mouse 126, or other user interface devices such asaudio output device 166 andaudio input device 168 tobus 112. The system hascommunication adapter 134 for connecting the information handling system to adata processing network 150, anddisplay adapter 136 for connectingbus 112 to displaydevice 138.Communication adapter 134 may link the system depicted in FIG. 1 with hundreds or even thousands of similar systems, or other devices, such as remote printers, remote servers, or remote storage units. The system depicted in FIG. 1 may be linked to both local area networks (sometimes referred to as Intranets) and wide area networks, such as the Internet. - While the computer system described in FIG. 1 is capable of executing the processes described herein, this computer system is simply one example of a computer system. Those skilled in the art will appreciate that many other computer system designs are capable of performing the processes described herein.
- FIG. 2 is a block diagram illustrating one example of how the present invention was implemented in a data center that hosted a web site. FIG. 2 shows a simplified example of a typical e-business infrastructure, including a variety of network, server, and middleware components. These components are symbolized by
server 270,server 280, and the boxes visible behindserver 270 andserver 280. As an overview, this example comprised: providing input from a plurality of probes, including events (symbolized by arrows pointing to console 205) generated by at least one application probe (shown at 221) and at least one component probe (shown at 271); and correlating the events. FIG. 2 showsapplication probe 221 andcomponent probe 271 providing input (symbolized by arrows) toconsole 205, which was used in correlating the events. - Turning now to some details of the example implementation, application probes such as
probe 221 measured response time for requests. The double-headed arrow connectinglocal application probe 221 withapplication 201 symbolizes requests and responses. - We located application probes locally at hosting sites (e.g. local application probe shown at 221, within data center 211) and remotely at relevant end-user sites (not shown in this diagram). This not only exercised the application code and application hosting site infrastructure, but also probed the ability of the application and network to deliver data from the application hosting site to the remote end-user sites. End-to-end measurement of IBM external applications (symbolized by
application 201 with web pages 202) for customers or business partners, for example, involved remote application probes (RAP's) on the Internet (shown at 290). We also measured the availability and performance of the application at the location where it was deployed (local application probe shown at 221, within data center 211). This provided baseline performance measurement data, that could be used for analyzing the performance measurements from the remote probes (not shown in this diagram). -
Local application probe 221 was implemented with a personal computer, utilizing IBM's Enterprise Probe Platform technology, but other kinds of hardware and software could be used. Alocal application probe 221 was placed on the IBM network just outside the firewall at the center where the web site was hosted. Alocal application probe 221 was used to probe one specific site per probe. There could be multiple scripts per site. Alocal application probe 221 executed the script every 20 minutes. Intervals of other lengths also could be used. -
Component probe 271 could be implemented with a personal computer running a script, but other kinds of hardware and software could be used.Component probe 271 could be implemented with software products (such as those available from TIVOLI, for example, or other similar products). These products provide a framework for probing infrastructure components. These products are available for various operating systems and middle ware components. - Another aspect of this example in FIG. 2 was providing an alert (i.e. an event signaling a problem) when
probe 221 or probe 271 detected an error. An example of an error inapplication 201 would be a measured response time value greater than a corresponding threshold value. For example, if alocal application probe 221 encountered a problem (e.g. it was unable to access the site or unable to complete the script) on two consecutive executions of the script,local application probe 221 generated a real time alert (problem event, symbolized by arrow pointing to console 205), and sent it to a TIVOLI management system (shown as console 205). Another similar kind of management system could be used. Thus an alert was provided via a system management computer. An alert message via email also could be used. Similarly,component probe 271 generated a problem event (symbolized by arrow pointing to console 205) when a component problem was detected. - Turning now to some details of providing input from a plurality of probes, Component Probes measure availability, utilization and performance of infrastructure components, including servers, LAN, and services. Local component probes (LCPs) may be deployed locally in hosting sites, service delivery centers or data centers (e.g. at 211).
- Network Probes measure network infrastructure response time and availability. Remote Network Probes (RNPs) may be deployed in a local hosting site or data center (e.g. at 211) if measuring the intranet or at Internet Service Provider (ISP) sites if measuring the Internet.
- Application Probes measure availability and performance of applications and business processes.
- Local Application Probe (LAP): Application probes deployed in a local hosting site or data center (e.g. at 211) are termed Local Application Probes.
- Remote Application Probe (RAP): An application probe deployed from a remote location is termed a Remote Application Probe.
- The concept of “probe” is a logical one. Thus for example, implementing a local component probe could actually consist of implementing multiple physical probes.
- Providing a script for an application probe would comprise defining a set of transactions that are frequently performed by end users. Employing a plurality of application probes would comprise placing at least one remote application probe (not shown in FIG. 2) at each location having a relatively large population of end users. Note that the Remote Application Probe transactions and Local Application Probe transactions should be the same transactions. The example measured all the transactions locally (shown at 221), so that the local application response time can be compared to the remote application response time. This can provide insight regarding application performance issues. End-to-end measurement of an organization's internal applications for internal customers will involve a RAP on an intranet, whereas end-to-end measurement of an organization's external applications for customers, business partners, suppliers, etc. will involve a RAP on the Internet (shown at 290). The example involved defining a representative transaction set, and deploying remote application probes at relevant end-user locations. (This simplicity is something that can only be appreciated when this example is contrasted with other more complicated models.) A benefit following from the simplicity of this example is that it is easily generalized to other environments besides web based applications.
Application 201 may be any client-server application. Some examples are a web site, a web application, database management software, a customer relationship management system, an enterprise resource planning system, or an opportunity—management business process where a client directly connects to a server. - The example in FIG. 2 comprised providing an alert when an error occurred. The alert may be provided via email, for example, or may be provided in real time via a network and a
system management computer 205. A clearing message may be provided when the error no longer is detected. In the example shown in FIG. 2,local application probe 221 generated a real time alert (problem event), and sent it to a TIVOLI management system (shown as console 205). Another similar kind of management system could be used. - The
local application probe 221 automatically sent events to themanagement console 205 used by the operations department. In the example solution, integration was provided with the TIVOLI MANAGEMENT ENVIRONMENT and the TIVOLI EVENT CONSOLE product. The example solution generated events from thelocal application probe 221, and the events were generated after two consecutive errors on the same step in the business process. This could then be adjusted to send an event on the first error, for even faster notification. The recommendation is to send events on the second occurrence initially and then adjust to sending the event on the first occurrence as the environment becomes more stable and better understood by the operational staff. The reason for the recommendation is that in a Web environment there are a number of things that can cause intermittent problems, and it is ultimately a business decision when to invoke problem determination procedures. - Consider the following example of a condition where an event was generated. This example involved probing a web site for selling computer hardware. There were executions of the probe script that failed on step two. (Regarding the steps involved, see Table 1 below.) The associated event sent to the TIVOLI ENTERPRISE CONSOLE had a severity of “Warning,” and documented the failure of step two, where the probe was unable to log on to the web site. Note that the date and time is the local time from the probe. In the examples below, “CRT” refers to a type of probe technology used by IBM. An example of an alert follows.
- Tivoli alert for CRT probe failure:
- Tivoli CRT Alert—PC NA
- WARNING (NAQS2 [LogonFailed/1])
- PCNa—Partner Commerce North America CRT Monitor
- tag:auth=crtGwaFw
- tag:message=PartnerCommerceNA https://ecna.partner.com Step-NAQS2-failed: Logon failed.
- tag:severity=WARNING
- tag:slot hostname=d03bpec18.pinfo.com
- tag:slot mail_svr=CVRM
- tag:slot mta=ecna.partner.com
- tag:slot probe_addr=NAQS2
- tag:slot probe_date=07/21
- tag:slot probe time=19:58
- tag:class=crt_event
- tag:source=SENTRY
- It is useful to automatically close opened events if a subsequent business process is executed successfully. This allows the operational staff to direct time and efforts to those events that remain in “open” status. Below is an example of such an event which was used to automatically close the previously opened event. The event was reported as severity HARMLESS and with the appropriate rules defined on the TIVOLI ENTERPRISE CONSOLE the previously opened event would be closed. This HARMLESS event was generated when the probe successfully executed the script and was able to log on to the web site. An example of such an event follows.
- Tivoli alert for CRT probe failure:
- Tivoli CRT Alert—PC NA
- HARMLESS (NAQS2 [Recoveredzf/0])
- PCNa—Partner Commerce North America CRT Monitor
- tag:auth=crtGwaFw
- tag:message=PartnerCommerceNA https://ecna.partner.com Step-NAQS2-failed: The problem causing the previous alert has been fixed.
- tag:severity=HARMLESS
- tag:slot hostname=d03 bpec18.pinfo.com
- tag:slot mail svr=CVRM
- tag:slot mta=ecna.partner.com
- tag:slot probe_addr=NAQS2
- tag:slot probe date=07/21
- tag:slot probe_time=21:43
- tag:class=crt_event
- tag:source=SENTRY
- FIG. 3 is a diagram showing an example of identifying a problem with one or more components, according to the present invention. FIG. 3 illustrates how operational staff may establish relationships among a
component problem 301,events performance problem 391 that affects a customer or other end user. Methods and systems are provided herein for assisting operational staff in reducing mean time to repair acomponent problem 301, and thus solve aperformance problem 391, for example. In FIG. 3, acomponent problem 301 is a root cause of aperformance problem 391, that affects a user of a client—server application.Component problem 301 is associated with events generated by probes:event 321, generated by an application probe, andevent 371, generated by a component probe. -
Event 321 signals a performance problem with an application. For example,event 321 might be similar to the problem event described above regarding FIG. 2, where a probe was unable to log on to a web site; orevent 321 might be generated when a “time out” problem is encountered at some transaction step. In this example,event 371 might alert operational staff that a disk failure has occurred on a server. In that case,component problem 301 would be a disk failure. Methods and systems are provided herein for correlating events such asevent 321 andevent 371. - The example in FIG. 3 may involve
component problem 301 causing aperformance problem 391, that affects a customer of a business. Thus the example in FIG. 3 may involve identifyingcomponent problem 301's impact on a business process that employs the component. Instead of a complete failure,performance problem 391 might be a response time that becomes too long to be acceptable for a customer. Such a situation might deserve intervention by operational staff before a complete failure occurs, depending on the importance of a business process that employs the component. Thus the example in FIG. 3 may involve directing problem—solving efforts, or identifying an opportunity to improve the performance of a client—server application, whether or not a complete failure occurs. - FIG. 4 is a flow chart illustrating one example of how end to end component mapping and problem solving may be implemented in an information technology consulting or design context. This example begins with identifying transaction steps, at
block 410. These transaction steps could be any steps that involve a client-server application. Some examples are steps involved in using a web site, a web application, web services, database management software, a customer relationship management system, an enterprise resource planning system, or an opportunity—management business process. The output from identifying transaction steps, atblock 410, may be a table containing the transaction step number, step name, and a description of what action the end user takes to execute the step. Table 1 below is an example of such a table, based on a web site for selling computer hardware.TABLE 1 Step No. Step name Description NAQS1 Open URL Go to URL http:// NAQS2 Logon Enter Login ID/Password. Click on Logon button. NAQS3 Navigation 1 Click on Personal Systems and NETFINITY NAQS4 Clear Form Select ‘Clear the form’. Click “ok” on pop-up window. NAQS5 Select Catalog Select Catalog Order from left hand navigation bar NAQS6 Select Printers Select Printers NAQS7 Select Printer Model Select Infoprint NAQS8 Add to Order Type 1 in Quantity box for 1st item Click Add to Order, Click OK on pop-up window NAQS9 Display Order Form Click on Go to order form NAQS10 Validate Order Click Save/Validate Items NAQS10A Home Page Click on “Overview” link NAQS11 Logoff Click Logoff. Click “ok” on popup - Another possible output from identifying transaction steps, at
block 410, may be a script to run on a local application probe or remote application probe. - Next in this example in FIG. 4 is block 420, identifying components associated with the transaction steps; this may involve identifying application components and identifying infrastructure components. A variety of network, server, and middle ware components may be identified. This may include resources indirectly involved with transaction steps, such as a link to a back-end system providing data to web site. This link might only be used during the night to push new content to a web site. If the link becomes unavailable, the web site will contain incorrect data. This might cause customer dissatisfaction or loss of revenue.
- A possible output from identifying components, at
block 420, may be a table containing the transaction step name, the name of an application supporting the step, and the data center where the application is hosted. Table 2 below is an example of such a table.TABLE 2 Supporting Data Step name Application center Open URL Application 1 Boulder Logon Application 2 Southbury Navigation 1 Application 1 Boulder Clear Form Application 1 Boulder Select Catalog Application 1 Boulder Select Printers Application 1 Boulder Select Printer Model Application 1 Boulder Add to Order Application 1 Boulder Display Order Form Application 1 Boulder Validate Order Application 3 Portsmouth Home Page Application 1 Boulder Logoff Application 1 Boulder - Another example of possible output from identifying components, at
block 420, may be a table such as Table 3 below. It identifies infrastructure components that support the individual applications.TABLE 3 Infrastructure Middleware Network Application dependencies dependencies dependencies Application 1 d0xx2111, MQSeries Link 9 d0xx2113, Channel A d0xx2115 Application 2 d0xx2112 MQSeries Link 9, Channel B Link 12 Application 3 d0xx2119 DB/2 database Link 15 Customer data - Next in this example is block 430, providing input associated with the transaction steps, from a plurality of probes. Typically the input would include at least one event generated by an application probe, and at least one event generated by a component probe. Providing input may further comprise determining specifications to support the deployment of the probes.
- Determining specifications may further comprise determining a plurality of specifications such as: a resource specification; a threshold value specification; an event severity specification; and an event class specification. For example, a resource specification would define an infrastructure resource to be probed, such as file space used on a server. A threshold value specification might be “file space 80% full,” for example. Examples of event severity specifications “warning” and “harmless” were given above in connection with FIG. 2. Regarding an event class specification, an infrastructure support team might address storage—related problems, and that team's console would be configured to receive the “sentry” class of events, for example. Various kinds of hardware and software resources would require various kinds of specifications to support the deployment of the probes.
- Next in this example in FIG. 4 is block 440, correlating events. For example, one may confirm a relationship between an event generated by an application probe, and an event generated by a component probe, as described above in connection with FIG. 3. A tool to help in correlating events is representing each of the components and each of the events with a structured identifier, where each of the identifiers has a limited number of parameters. The parameters typically would include depth, component name, parent component, business process name, and criticality. Other parameters could be used as well. Regarding the depth parameter, for example, one implementation used a hierarchy with a limited number of levels, where Level 0 was the highest level of a business process. Level 6, the lowest level, contained events generated by component probes (e.g. a component probe on server). Some examples of representing each component and each event with a structured identifier are shown below in Table 4. This example involved a business process for customer relationship management called “CRM2000,” at Level 0. Each line in Table 4 contains the same business process name, “CRM2000.” This allows correlating events, and allows identifying a component problem's impact on a business process that employs the component.
TABLE 4 Examples of structured identifiers for some components and events BUSINESS DEPTH/ PARENT PROCESS LEVEL NAME COMPONENT NAME CRITICALITY 3 Timeout Open Leads CRM2000 Warning 5 d0xx GWA CRM2000 Critical 6 Inetd d0xx CRM2000 Critical 6 Disk failure d0xx CRM2000 Critical - Table 4 shows an example using five parameters (depth, name, parent component, business process name, and criticality) to give a logical view of a business process, its components and events. This example used levels numbered from 0 to 6. Level 0 was the highest level of a business process, CRM2000. Level 1 contained components (subprocesses) of CRM2000: “Marketing” and “Sales.” Level 2 contained a subprocess of Sales: a “Lead Opportunity Management” application, with a user interface utilized by end users. Level 3 contained transaction steps, and events generated by application probes. Level 4 contained logical components in the infrastructure, such as IBM's Global Web Architecture (GWA), an environment that hosts web servers. Level 5 contained infrastructure components such as servers. Level 6, the lowest level, contained events generated by component probes. Component “d0xx” was a server. “Timeout” was an event generated by an application probe; “Inetd” and “Disk failure” were events generated by component probes.
- Variations in the depth parameter are possible. Another example used levels numbered from 0 to 7, where hardware and software classes of components were at Level 6, and the events “Inetd” and “Disk failure” were at Level 7.
- The event “Inetd” indicated a problem with a software component (inetd, the Internet super—server daemon, in an operating system such as UNIX, LINUX, or IBM's AIX). The event “Disk failure” indicated a problem with a hardware component (a disk).
- In contrast to Table 4, a structured identifier may be expressed in plain text, following this pattern, for example: (Depth, Component Name, Parent Component, Business Process Name, Criticality). For example a software component “inetd” could have the following identifier: (6, inetd, d0xx1, CRM2000, Critical). This identifier identifies the position of each component, and retains the data pertaining to its relationships and dependencies. The same software component “inetd,” regarding its utilization in another application or business process called “CVRM,” could have the following identifier: (6, inetd, d0xx1, CVRM, Critical).
- Some examples of additional parameters that could be used with the five parameters shown above are problem determination, destination, and service level agreement parameters. First, an additional parameter for problem determination (PD) can be added. The purpose of this parameter would be to associate problem determination procedures to every event generated. This parameter could be used to identify the actions or procedures to be used when this event is generated. These actions or procedures can be automatic (e.g. identifying a program or function to be automatically executed when the event occurs). Another implementation could be to use this parameter as an index into an operational repository to retrieve written instructions to be followed to correct the problem. Depending on the missions of different organizations, the operational procedures will vary. In the example in Table 4, where we had a problem with the inetd daemon, the automated PD process could be to run the appropriate shell script to restart the inetd daemon. In the case of a disk crash, the operational procedure could be a reference to a document describing how to replace broken hardware and apply the necessary backup and restore procedures. On depth level 2 the PD parameter could refer to an automated or written process for how the business owner of the process is contacted and informed about the business impact of the infrastructure problem.
- A second example would be to add a destination parameter to the event. Most likely several different teams are involved in the management of an end to end business process. These teams have different missions and accordingly different roles and responsibilities. For example an eBusiness Center could have a mission to manage the end to end process from a customer perspective and the service delivery centers could perform traditional information technology services. The destination (i.e. a target audience or event console) parameter could be used to indicate that the event documenting the disk crash has been sent to an event console used by the service delivery center with a responsibility to address infrastructure problems. The service delivery center may receive the disk crash event as CRITICAL. The same event could be sent to different destinations with different values in the criticality parameter, depending on the roles and responsibilities of the target audience. The disk crash event could be sent to the eBusiness Command Center and could have a criticality value of WARNING.
- Thirdly, Service Level Agreements (SLA's) are most likely in place for the whole end to end system and in many cases the individual components. Adding an SLA parameter would allow this parameter to be used as an index into a repository of existing SLA's. Again, these SLA's differ based on the missions of the organizations, so the end to end SLA documents the availability agreement for the customer process, and the SLA for infrastructure documents hardware availability etc. Since these SLA's are commitments by the service providers and could impose penalties, it is useful to direct problem resolution activities in accordance with the service level commitments. More sophisticated implementations could include automatic data collection for SLA attainment calculations.
- In various situations, various combinations of these parameters may be used. For example, an enterprise could use the problem determination parameter but not the SLA parameter (they may not have an SLA). Another situation could be an enterprise who has an SLA but has not implemented automated or manual operational processes in support of their SLA commitments.
- To conclude the description of FIG. 4, next in this example is block 450, directing problem—solving efforts. Some examples of this were given above, regarding parameters and structured identifiers. Finally in this example is block 460, improving performance; typically this would involve identifying an opportunity to improve the performance of one or more client—server applications. For example, performance degradation caused by specific components could be ascertained, and proactive measures could be taken to improve performance.
- FIG. 5 is a flow chart illustrating one example of how end to end component mapping and problem solving may be implemented in an operations context. This example begins at
block 510, with providing input from a plurality of probes. Typically the input would include at least one event generated by an application probe, and at least one event generated by a component probe. Next in this example is block 520, employing structured identifiers. Typically this would involve representing each of the components and each of the events with a structured identifier, where each of the identifiers has a limited number of parameters, as discussed above regarding Table 4. Structured identifiers may be employed to do one or more tasks such as inputting data, storing data, and outputting data. For example, operational staff could use a form similar to Table 4 above for inputting or outputting data. A form similar to Table 4 could be printed on paper or displayed on a screen. Other examples based on Table 4 would be utilizing a data structure in which each component and each event has a unique five-parameter identifier, or utilizing a programming object that includes a five-parameter identifier. Additional parameters could be used, as discussed above, with corresponding variations in forms or data structures. - Next in this example is block 530, correlating events. As discussed above, a tool to help in correlating events is the structured identifier that identifies the position of each component and each event, and retains the data pertaining to its relationships and dependencies. For example, one may confirm a relationship between an event generated by an application probe, and an event generated by a component probe, as described above in connection with FIG. 3.
- Next in this example in FIG. 5 is block 540, identifying a component problem, followed by
block 550, solving the component problem (and thus solving the performance problem affecting a user of an application). Problem—solving examples involving hardware and software failures were given above, regarding parameters and structured identifiers. In another example mentioned above, performance degradation caused by specific components could be ascertained, and proactive measures could be taken to improve performance. - Those skilled in the art will recognize that blocks in the above-mentioned flow charts could be arranged in a somewhat different order, but still describe the invention. Blocks could be added to the above-mentioned flow charts to describe details, or optional features; some blocks could be subtracted to show a simplified example.
- In conclusion, we have shown examples of methods and systems for End to end component mapping and problem—solving in a network environment.
- One of the preferred implementations of the invention is an application, namely a set of instructions (program code) in a code module which may, for example, be resident in the random access memory of a computer. Until required by the computer, the set of instructions may be stored in another computer memory, for example, in a hard disk drive, or in a removable memory such as an optical disk (for eventual use in a CD ROM) or floppy disk (for eventual use in a floppy disk drive), or downloaded via the Internet or other computer network. Thus, the present invention may be implemented as a computer-usable medium having computer-executable instructions for use in a computer. In addition, although the various methods described are conveniently implemented in a general-purpose computer selectively activated or reconfigured by software, one of ordinary skill in the art would also recognize that such methods may be carried out in hardware, in firmware, or in more specialized apparatus constructed to perform the required method steps.
- While the invention has been shown and described with reference to particular embodiments thereof, it will be understood by those skilled in the art that the foregoing and other changes in form and detail may be made therein without departing from the spirit and scope of the invention. The appended claims are to encompass within their scope all such changes and modifications as are within the true spirit and scope of this invention. Furthermore, it is to be understood that the invention is solely defined by the appended claims. It will be understood by those with skill in the art that if a specific number of an introduced claim element is intended, such intent will be explicitly recited in the claim, and in the absence of such recitation no such limitation is present. For non-limiting example, as an aid to understanding, the appended claims may contain the introductory phrases at least one or one or more to introduce claim elements. However, the use of such phrases should not be construed to imply that the introduction of a claim element by indefinite articles such as a or an limits any particular claim containing such introduced claim element to inventions containing only one such element, even when the same claim includes the introductory phrases at least one or one or more and indefinite articles such as a or an; the same holds true for the use in the claims of definite articles.
Claims (34)
Priority Applications (3)
| Application Number | Priority Date | Filing Date | Title |
|---|---|---|---|
| US10/122,001 US7047291B2 (en) | 2002-04-11 | 2002-04-11 | System for correlating events generated by application and component probes when performance problems are identified |
| US13/949,547 US9253057B2 (en) | 2002-01-31 | 2013-07-24 | Evaluation of performance of software applications |
| US14/986,754 US9996408B2 (en) | 2002-01-31 | 2016-01-04 | Evaluation of performance of software applications |
Applications Claiming Priority (1)
| Application Number | Priority Date | Filing Date | Title |
|---|---|---|---|
| US10/122,001 US7047291B2 (en) | 2002-04-11 | 2002-04-11 | System for correlating events generated by application and component probes when performance problems are identified |
Publications (2)
| Publication Number | Publication Date |
|---|---|
| US20030195961A1 true US20030195961A1 (en) | 2003-10-16 |
| US7047291B2 US7047291B2 (en) | 2006-05-16 |
Family
ID=28790460
Family Applications (1)
| Application Number | Title | Priority Date | Filing Date |
|---|---|---|---|
| US10/122,001 Expired - Fee Related US7047291B2 (en) | 2002-01-31 | 2002-04-11 | System for correlating events generated by application and component probes when performance problems are identified |
Country Status (1)
| Country | Link |
|---|---|
| US (1) | US7047291B2 (en) |
Cited By (8)
| Publication number | Priority date | Publication date | Assignee | Title |
|---|---|---|---|---|
| US20040158429A1 (en) * | 2003-02-10 | 2004-08-12 | Bary Emad Abdel | Method and system for classifying content and prioritizing web site content issues |
| US20040205187A1 (en) * | 2003-04-11 | 2004-10-14 | Mehmet Sayal | Correlation of web service interactions in composite web services |
| US20050172027A1 (en) * | 2004-02-02 | 2005-08-04 | Castellanos Maria G. | Management of service level agreements for composite Web services |
| WO2005083571A1 (en) * | 2004-03-01 | 2005-09-09 | Izuki Corporation | A method of controlling the operation of a computing system arranged to interact with other entities |
| US20070208852A1 (en) * | 2006-03-06 | 2007-09-06 | B-Hive Networks, Inc. | Network sniffer for performing service level management |
| US20090313273A1 (en) * | 2006-03-06 | 2009-12-17 | Vmware, Inc. | service level management system |
| US20100125757A1 (en) * | 2008-11-14 | 2010-05-20 | Hong Fu Jin Precision Industry (Shenzhen) Co., Ltd. | System and method for correcting errors in downloading web pages |
| US8200520B2 (en) | 2007-10-03 | 2012-06-12 | International Business Machines Corporation | Methods, systems, and apparatuses for automated confirmations of meetings |
Families Citing this family (26)
| Publication number | Priority date | Publication date | Assignee | Title |
|---|---|---|---|---|
| US7546354B1 (en) * | 2001-07-06 | 2009-06-09 | Emc Corporation | Dynamic network based storage with high availability |
| US8086720B2 (en) * | 2002-01-31 | 2011-12-27 | International Business Machines Corporation | Performance reporting in a network environment |
| US7269651B2 (en) * | 2002-09-26 | 2007-09-11 | International Business Machines Corporation | E-business operations measurements |
| US8527620B2 (en) | 2003-03-06 | 2013-09-03 | International Business Machines Corporation | E-business competitive measurements |
| US7412502B2 (en) * | 2002-04-18 | 2008-08-12 | International Business Machines Corporation | Graphics for end to end component mapping and problem-solving in a network environment |
| US7246144B2 (en) * | 2002-03-25 | 2007-07-17 | Data Quality Solutions | Method and system for managing a plurality of enterprise business systems |
| US7457864B2 (en) * | 2002-11-27 | 2008-11-25 | International Business Machines Corporation | System and method for managing the performance of a computer system based on operational characteristics of the system components |
| US20040205184A1 (en) * | 2003-03-06 | 2004-10-14 | International Business Machines Corporation | E-business operations measurements reporting |
| WO2005020019A2 (en) * | 2003-08-22 | 2005-03-03 | Data Quality Solutions, Inc. | Method and system for managing a plurality of enterprise business process systems |
| US7269645B2 (en) * | 2003-10-31 | 2007-09-11 | International Business Machines Corporation | Seamless migration of one or more business processes and their work environment between computing devices and a network |
| US20060031469A1 (en) * | 2004-06-29 | 2006-02-09 | International Business Machines Corporation | Measurement, reporting, and management of quality of service for a real-time communication application in a network environment |
| US7996515B2 (en) * | 2005-06-15 | 2011-08-09 | Bmc Software, Inc. | Network transaction discovery |
| US20090254970A1 (en) * | 2008-04-04 | 2009-10-08 | Avaya Inc. | Multi-tier security event correlation and mitigation |
| US8903757B2 (en) | 2008-12-12 | 2014-12-02 | Appnomic Systems Private Limited | Proactive information technology infrastructure management |
| US8060782B2 (en) * | 2010-03-01 | 2011-11-15 | Microsoft Corporation | Root cause problem identification through event correlation |
| US20110302652A1 (en) | 2010-06-07 | 2011-12-08 | Novell, Inc. | System and method for detecting real-time security threats in a network datacenter |
| US9684670B2 (en) * | 2012-06-13 | 2017-06-20 | Microsoft Technology Licensing, Llc | Moving shared files |
| US9262253B2 (en) | 2012-06-28 | 2016-02-16 | Microsoft Technology Licensing, Llc | Middlebox reliability |
| US9229800B2 (en) | 2012-06-28 | 2016-01-05 | Microsoft Technology Licensing, Llc | Problem inference from support tickets |
| US9565080B2 (en) | 2012-11-15 | 2017-02-07 | Microsoft Technology Licensing, Llc | Evaluating electronic network devices in view of cost and service level considerations |
| US9325748B2 (en) | 2012-11-15 | 2016-04-26 | Microsoft Technology Licensing, Llc | Characterizing service levels on an electronic network |
| US9350601B2 (en) | 2013-06-21 | 2016-05-24 | Microsoft Technology Licensing, Llc | Network event processing and prioritization |
| US9596164B1 (en) * | 2014-06-26 | 2017-03-14 | Juniper Networks, Inc. | Application visibility in layer 3 networks |
| US9964590B2 (en) | 2015-02-27 | 2018-05-08 | At&T Intellectual Property I, L.P. | Configurable probe blocks for system monitoring |
| US10735522B1 (en) * | 2019-08-14 | 2020-08-04 | ProKarma Inc. | System and method for operation management and monitoring of bots |
| FR3105464A1 (en) * | 2019-12-23 | 2021-06-25 | Bull Sas | Method and computer system for validating an IT infrastructure by mining |
Citations (32)
| Publication number | Priority date | Publication date | Assignee | Title |
|---|---|---|---|---|
| US5459837A (en) * | 1993-04-21 | 1995-10-17 | Digital Equipment Corporation | System to facilitate efficient utilization of network resources in a computer network |
| US5742819A (en) * | 1993-06-04 | 1998-04-21 | Digital Equipment Corporation | System and method for dynamically analyzing and improving the performance of a network |
| US5787254A (en) * | 1997-03-14 | 1998-07-28 | International Business Machines Corporation | Web browser method and system for display and management of server latency |
| US5872973A (en) * | 1995-10-26 | 1999-02-16 | Viewsoft, Inc. | Method for managing dynamic relations between objects in dynamic object-oriented languages |
| US6000045A (en) * | 1996-05-28 | 1999-12-07 | Cabletron Systems, Inc. | Method and apparatus for inter-domain alarm correlation |
| US6055493A (en) * | 1997-01-29 | 2000-04-25 | Infovista S.A. | Performance measurement and service quality monitoring system and process for an information system |
| US6070190A (en) * | 1998-05-11 | 2000-05-30 | International Business Machines Corporation | Client-based application availability and response monitoring and reporting for distributed computing environments |
| US6078956A (en) * | 1997-09-08 | 2000-06-20 | International Business Machines Corporation | World wide web end user response time monitor |
| US6141699A (en) * | 1998-05-11 | 2000-10-31 | International Business Machines Corporation | Interactive display system for sequential retrieval and display of a plurality of interrelated data sets |
| US6151688A (en) * | 1997-02-21 | 2000-11-21 | Novell, Inc. | Resource management in a clustered computer system |
| US6175832B1 (en) * | 1998-05-11 | 2001-01-16 | International Business Machines Corporation | Method, system and program product for establishing a data reporting and display communication over a network |
| US6278966B1 (en) * | 1998-06-18 | 2001-08-21 | International Business Machines Corporation | Method and system for emulating web site traffic to identify web site usage patterns |
| US20020004828A1 (en) * | 1999-02-23 | 2002-01-10 | Davis Kenton T. | Element management system for heterogeneous telecommunications network |
| US6401119B1 (en) * | 1998-09-18 | 2002-06-04 | Ics Intellegent Communication Software Gmbh | Method and system for monitoring and managing network condition |
| US20020073195A1 (en) * | 2000-12-07 | 2002-06-13 | Hellerstein Joseph L. | Method and system for machine-aided rule construction for event management |
| US20020087882A1 (en) * | 2000-03-16 | 2002-07-04 | Bruce Schneier | Mehtod and system for dynamic network intrusion monitoring detection and response |
| US6425006B1 (en) * | 1997-05-13 | 2002-07-23 | Micron Technology, Inc. | Alert configurator and manager |
| US6457143B1 (en) * | 1999-09-30 | 2002-09-24 | International Business Machines Corporation | System and method for automatic identification of bottlenecks in a network |
| US20020161875A1 (en) * | 2001-04-30 | 2002-10-31 | Raymond Robert L. | Dynamic generation of context-sensitive data and instructions for troubleshooting problem events in information network systems |
| US20030061232A1 (en) * | 2001-09-21 | 2003-03-27 | Dun & Bradstreet Inc. | Method and system for processing business data |
| US6587878B1 (en) * | 1999-05-12 | 2003-07-01 | International Business Machines Corporation | System, method, and program for measuring performance in a network system |
| US20030145079A1 (en) * | 2002-01-31 | 2003-07-31 | International Business Machines Corporation | Method and system for probing in a network environment |
| US20030145080A1 (en) * | 2002-01-31 | 2003-07-31 | International Business Machines Corporation | Method and system for performance reporting in a network environment |
| US20030167406A1 (en) * | 2002-02-25 | 2003-09-04 | Beavers John B. | System and method for tracking and filtering alerts in an enterprise and generating alert indications for analysis |
| US20040064546A1 (en) * | 2002-09-26 | 2004-04-01 | International Business Machines Corporation | E-business operations measurements |
| US20040078684A1 (en) * | 2000-10-27 | 2004-04-22 | Friedman George E. | Enterprise test system having run time test object generation |
| US6766368B1 (en) * | 2000-05-23 | 2004-07-20 | Verizon Laboratories Inc. | System and method for providing an internet-based correlation service |
| US6779032B1 (en) * | 1999-07-01 | 2004-08-17 | International Business Machines Corporation | Method and system for optimally selecting a Telnet 3270 server in a TCP/IP network |
| US20040205184A1 (en) * | 2003-03-06 | 2004-10-14 | International Business Machines Corporation | E-business operations measurements reporting |
| US6853619B1 (en) * | 1999-02-26 | 2005-02-08 | Ipanema Technologies | System and method for measuring the transfer durations and loss rates in high volume telecommunication networks |
| US6885302B2 (en) * | 2002-07-31 | 2005-04-26 | Itron Electricity Metering, Inc. | Magnetic field sensing for tamper identification |
| US6892235B1 (en) * | 1999-03-05 | 2005-05-10 | International Business Machines Corporation | Method and system for optimally selecting a web firewall in a TCB/IP network |
Family Cites Families (22)
| Publication number | Priority date | Publication date | Assignee | Title |
|---|---|---|---|---|
| US5812780A (en) | 1996-05-24 | 1998-09-22 | Microsoft Corporation | Method, system, and product for assessing a server application performance |
| US5793753A (en) | 1996-09-17 | 1998-08-11 | Coherent Communications Systems Corp. | Telecommunications network management observation and response system |
| GB9702849D0 (en) | 1997-02-12 | 1997-04-02 | Trafficmaster Plc | Traffic monitoring |
| US6108700A (en) | 1997-08-01 | 2000-08-22 | International Business Machines Corporation | Application end-to-end response time measurement and decomposition |
| US6327550B1 (en) | 1998-05-26 | 2001-12-04 | Computer Associates Think, Inc. | Method and apparatus for system state monitoring using pattern recognition and neural networks |
| US6356205B1 (en) | 1998-11-30 | 2002-03-12 | General Electric | Monitoring, diagnostic, and reporting system and process |
| US6278694B1 (en) | 1999-04-16 | 2001-08-21 | Concord Communications Inc. | Collecting and reporting monitoring data from remote network probes |
| US6765864B1 (en) | 1999-06-29 | 2004-07-20 | Cisco Technology, Inc. | Technique for providing dynamic modification of application specific policies in a feedback-based, adaptive data network |
| US6449739B1 (en) | 1999-09-01 | 2002-09-10 | Mercury Interactive Corporation | Post-deployment monitoring of server performance |
| US6832341B1 (en) | 1999-09-23 | 2004-12-14 | International Business Machines Corporation | Fault event management using fault monitoring points |
| US6901442B1 (en) | 2000-01-07 | 2005-05-31 | Netiq Corporation | Methods, system and computer program products for dynamic filtering of network performance test results |
| US6763380B1 (en) | 2000-01-07 | 2004-07-13 | Netiq Corporation | Methods, systems and computer program products for tracking network device performance |
| US6904458B1 (en) | 2000-04-26 | 2005-06-07 | Microsoft Corporation | System and method for remote management |
| US6792455B1 (en) | 2000-04-28 | 2004-09-14 | Microsoft Corporation | System and method for implementing polling agents in a client management tool |
| US6732168B1 (en) | 2000-07-05 | 2004-05-04 | Lucent Technologies Inc. | Method and apparatus for use in specifying and insuring policies for management of computer networks |
| US20020032793A1 (en) | 2000-09-08 | 2002-03-14 | The Regents Of The University Of Michigan | Method and system for reconstructing a path taken by undesirable network traffic through a computer network from a source of the traffic |
| US6807156B1 (en) | 2000-11-07 | 2004-10-19 | Telefonaktiebolaget Lm Ericsson (Publ) | Scalable real-time quality of service monitoring and analysis of service dependent subscriber satisfaction in IP networks |
| US6857020B1 (en) | 2000-11-20 | 2005-02-15 | International Business Machines Corporation | Apparatus, system, and method for managing quality-of-service-assured e-business service systems |
| US6889222B1 (en) | 2000-12-26 | 2005-05-03 | Aspect Communications Corporation | Method and an apparatus for providing personalized service |
| US6928471B2 (en) | 2001-05-07 | 2005-08-09 | Quest Software, Inc. | Method and apparatus for measurement, analysis, and optimization of content delivery |
| US6871324B2 (en) | 2001-05-25 | 2005-03-22 | International Business Machines Corporation | Method and apparatus for efficiently and dynamically updating monitored metrics in a heterogeneous system |
| US6934745B2 (en) | 2001-06-28 | 2005-08-23 | Packeteer, Inc. | Methods, apparatuses and systems enabling a network services provider to deliver application performance management services |
-
2002
- 2002-04-11 US US10/122,001 patent/US7047291B2/en not_active Expired - Fee Related
Patent Citations (33)
| Publication number | Priority date | Publication date | Assignee | Title |
|---|---|---|---|---|
| US5459837A (en) * | 1993-04-21 | 1995-10-17 | Digital Equipment Corporation | System to facilitate efficient utilization of network resources in a computer network |
| US5742819A (en) * | 1993-06-04 | 1998-04-21 | Digital Equipment Corporation | System and method for dynamically analyzing and improving the performance of a network |
| US5872973A (en) * | 1995-10-26 | 1999-02-16 | Viewsoft, Inc. | Method for managing dynamic relations between objects in dynamic object-oriented languages |
| US6000045A (en) * | 1996-05-28 | 1999-12-07 | Cabletron Systems, Inc. | Method and apparatus for inter-domain alarm correlation |
| US6430712B2 (en) * | 1996-05-28 | 2002-08-06 | Aprisma Management Technologies, Inc. | Method and apparatus for inter-domain alarm correlation |
| US6055493A (en) * | 1997-01-29 | 2000-04-25 | Infovista S.A. | Performance measurement and service quality monitoring system and process for an information system |
| US6151688A (en) * | 1997-02-21 | 2000-11-21 | Novell, Inc. | Resource management in a clustered computer system |
| US5787254A (en) * | 1997-03-14 | 1998-07-28 | International Business Machines Corporation | Web browser method and system for display and management of server latency |
| US6425006B1 (en) * | 1997-05-13 | 2002-07-23 | Micron Technology, Inc. | Alert configurator and manager |
| US6078956A (en) * | 1997-09-08 | 2000-06-20 | International Business Machines Corporation | World wide web end user response time monitor |
| US6141699A (en) * | 1998-05-11 | 2000-10-31 | International Business Machines Corporation | Interactive display system for sequential retrieval and display of a plurality of interrelated data sets |
| US6175832B1 (en) * | 1998-05-11 | 2001-01-16 | International Business Machines Corporation | Method, system and program product for establishing a data reporting and display communication over a network |
| US6070190A (en) * | 1998-05-11 | 2000-05-30 | International Business Machines Corporation | Client-based application availability and response monitoring and reporting for distributed computing environments |
| US6278966B1 (en) * | 1998-06-18 | 2001-08-21 | International Business Machines Corporation | Method and system for emulating web site traffic to identify web site usage patterns |
| US6401119B1 (en) * | 1998-09-18 | 2002-06-04 | Ics Intellegent Communication Software Gmbh | Method and system for monitoring and managing network condition |
| US20020004828A1 (en) * | 1999-02-23 | 2002-01-10 | Davis Kenton T. | Element management system for heterogeneous telecommunications network |
| US6853619B1 (en) * | 1999-02-26 | 2005-02-08 | Ipanema Technologies | System and method for measuring the transfer durations and loss rates in high volume telecommunication networks |
| US6892235B1 (en) * | 1999-03-05 | 2005-05-10 | International Business Machines Corporation | Method and system for optimally selecting a web firewall in a TCB/IP network |
| US6587878B1 (en) * | 1999-05-12 | 2003-07-01 | International Business Machines Corporation | System, method, and program for measuring performance in a network system |
| US6779032B1 (en) * | 1999-07-01 | 2004-08-17 | International Business Machines Corporation | Method and system for optimally selecting a Telnet 3270 server in a TCP/IP network |
| US6457143B1 (en) * | 1999-09-30 | 2002-09-24 | International Business Machines Corporation | System and method for automatic identification of bottlenecks in a network |
| US20020087882A1 (en) * | 2000-03-16 | 2002-07-04 | Bruce Schneier | Mehtod and system for dynamic network intrusion monitoring detection and response |
| US6766368B1 (en) * | 2000-05-23 | 2004-07-20 | Verizon Laboratories Inc. | System and method for providing an internet-based correlation service |
| US20040078684A1 (en) * | 2000-10-27 | 2004-04-22 | Friedman George E. | Enterprise test system having run time test object generation |
| US20020073195A1 (en) * | 2000-12-07 | 2002-06-13 | Hellerstein Joseph L. | Method and system for machine-aided rule construction for event management |
| US20020161875A1 (en) * | 2001-04-30 | 2002-10-31 | Raymond Robert L. | Dynamic generation of context-sensitive data and instructions for troubleshooting problem events in information network systems |
| US20030061232A1 (en) * | 2001-09-21 | 2003-03-27 | Dun & Bradstreet Inc. | Method and system for processing business data |
| US20030145079A1 (en) * | 2002-01-31 | 2003-07-31 | International Business Machines Corporation | Method and system for probing in a network environment |
| US20030145080A1 (en) * | 2002-01-31 | 2003-07-31 | International Business Machines Corporation | Method and system for performance reporting in a network environment |
| US20030167406A1 (en) * | 2002-02-25 | 2003-09-04 | Beavers John B. | System and method for tracking and filtering alerts in an enterprise and generating alert indications for analysis |
| US6885302B2 (en) * | 2002-07-31 | 2005-04-26 | Itron Electricity Metering, Inc. | Magnetic field sensing for tamper identification |
| US20040064546A1 (en) * | 2002-09-26 | 2004-04-01 | International Business Machines Corporation | E-business operations measurements |
| US20040205184A1 (en) * | 2003-03-06 | 2004-10-14 | International Business Machines Corporation | E-business operations measurements reporting |
Cited By (15)
| Publication number | Priority date | Publication date | Assignee | Title |
|---|---|---|---|---|
| US7624173B2 (en) * | 2003-02-10 | 2009-11-24 | International Business Machines Corporation | Method and system for classifying content and prioritizing web site content issues |
| US20040158429A1 (en) * | 2003-02-10 | 2004-08-12 | Bary Emad Abdel | Method and system for classifying content and prioritizing web site content issues |
| US20040205187A1 (en) * | 2003-04-11 | 2004-10-14 | Mehmet Sayal | Correlation of web service interactions in composite web services |
| US7912938B2 (en) * | 2003-04-11 | 2011-03-22 | Hewlett-Packard Development Company, L.P. | Correlation of web service interactions in composite web services |
| US20050172027A1 (en) * | 2004-02-02 | 2005-08-04 | Castellanos Maria G. | Management of service level agreements for composite Web services |
| WO2005083571A1 (en) * | 2004-03-01 | 2005-09-09 | Izuki Corporation | A method of controlling the operation of a computing system arranged to interact with other entities |
| US20090313273A1 (en) * | 2006-03-06 | 2009-12-17 | Vmware, Inc. | service level management system |
| US20100094916A1 (en) * | 2006-03-06 | 2010-04-15 | Vmware, Inc. | Service Level Management System |
| US20070208852A1 (en) * | 2006-03-06 | 2007-09-06 | B-Hive Networks, Inc. | Network sniffer for performing service level management |
| US8656000B2 (en) | 2006-03-06 | 2014-02-18 | Vmware, Inc. | Service level management system |
| US8683041B2 (en) | 2006-03-06 | 2014-03-25 | Vmware, Inc. | Service level management system |
| US8892737B2 (en) * | 2006-03-06 | 2014-11-18 | Vmware, Inc. | Network sniffer for performing service level management |
| US8200520B2 (en) | 2007-10-03 | 2012-06-12 | International Business Machines Corporation | Methods, systems, and apparatuses for automated confirmations of meetings |
| US20100125757A1 (en) * | 2008-11-14 | 2010-05-20 | Hong Fu Jin Precision Industry (Shenzhen) Co., Ltd. | System and method for correcting errors in downloading web pages |
| US8015453B2 (en) * | 2008-11-14 | 2011-09-06 | Hong Fu Jin Precision Industry (Shenzhen) Co., Ltd. | System and method for correcting errors in downloading web pages |
Also Published As
| Publication number | Publication date |
|---|---|
| US7047291B2 (en) | 2006-05-16 |
Similar Documents
| Publication | Publication Date | Title |
|---|---|---|
| US7047291B2 (en) | System for correlating events generated by application and component probes when performance problems are identified | |
| US7412502B2 (en) | Graphics for end to end component mapping and problem-solving in a network environment | |
| US8086720B2 (en) | Performance reporting in a network environment | |
| JP4426797B2 (en) | Method and apparatus for dependency-based impact simulation and vulnerability analysis | |
| US8751283B2 (en) | Defining and using templates in configuring information technology environments | |
| US7505872B2 (en) | Methods and apparatus for impact analysis and problem determination | |
| KR100763326B1 (en) | Methods and apparatus for root cause identification and problem determination in distributed systems | |
| US7240325B2 (en) | Methods and apparatus for topology discovery and representation of distributed applications and services | |
| US7043549B2 (en) | Method and system for probing in a network environment | |
| US8276161B2 (en) | Business systems management solution for end-to-end event management using business system operational constraints | |
| US9996408B2 (en) | Evaluation of performance of software applications | |
| JP2004103015A (en) | Method and apparatus for managing dependency in distributed system | |
| CA2455079A1 (en) | System and method for automated analysis of load testing results | |
| US7269651B2 (en) | E-business operations measurements | |
| US20150012647A1 (en) | Router-based end-user performance monitoring | |
| US7954062B2 (en) | Application status board mitigation system and method | |
| US7380244B1 (en) | Status display tool | |
| Bussiere et al. | Status Display Tool | |
| Bateman et al. | Applications Analysis: Principles and Examples from Various Distributed Computer Applications at Sandia National Laboratories New Mexico | |
| Clarke | Web-based testing and capacity planning | |
| E-BUSINESS | E-business Impact on IT Management |
Legal Events
| Date | Code | Title | Description |
|---|---|---|---|
| AS | Assignment |
Owner name: INTERNATIONAL BUSINESS MACHINES CORPORATION, NEW Y Free format text: ASSIGNMENT OF ASSIGNORS INTEREST;ASSIGNORS:BREESE, STEPHEN S.;OLSSON, STIG ARNE;VIJAYAN, GEETHA;REEL/FRAME:015168/0431 Effective date: 20020403 |
|
| FEPP | Fee payment procedure |
Free format text: PAYOR NUMBER ASSIGNED (ORIGINAL EVENT CODE: ASPN); ENTITY STATUS OF PATENT OWNER: LARGE ENTITY |
|
| FPAY | Fee payment |
Year of fee payment: 4 |
|
| REMI | Maintenance fee reminder mailed | ||
| LAPS | Lapse for failure to pay maintenance fees | ||
| STCH | Information on status: patent discontinuation |
Free format text: PATENT EXPIRED DUE TO NONPAYMENT OF MAINTENANCE FEES UNDER 37 CFR 1.362 |
|
| FP | Lapsed due to failure to pay maintenance fee |
Effective date: 20140516 |